How to visualize .NET Core API usage with Prometheus and Grafana (.NET 6)

If you like me would like to know about the usage of your API and take actions based on raw data, then you for sure would like to track and visualize API usage. Some great things you also would be capable of doing are charging a customer based on the number of API calls made against the backend or you would like to get actionable insights on the popularity of a certain API.
In this tutorial, I will be teaching you how to get up and running with Prometheus and Grafana in a few minutes using Docker. Then we will take a look at how we can implement Prometheus in .NET Core to track the API usage.
If you are ready, then let’s get going.
Getting up and running with Prometheus and Grafana
As described above I will be using Docker to run two containers with Prometheus and Grafana. Below is a docker-compose file, that will set up the two required containers for you.
version: '1.0'

services:

  prometheus:
    image: ubuntu/prometheus
    container_name: dev_prometheus_test
    ports:
      - "30090:9090"
    environment:
      - TZ=Europe/Copenhagen
    volumes:
      - ./prom/prometheus.yml:/etc/prometheus/prometheus.yml

  grafana:
    image: grafana/grafana
    container_name: dev_grafana_test
    ports:
      - "30091:3000"
    volumes:
      - ./grafana-data/data:/var/lib/grafana
An explanation of the above:
- First we specify a version for the compose file.
- Then we specify the services
- Prometheus – The image is ubuntu/prometheus and is named
dev_prometheus_test, you are free to name it whatever you want. Then we populate it on port30090, set the timezone to be Copenhagen (I’m from Denmark). Here is a list of tz time zones and then we mount the configuration for prometheus to be at/prom/prometheus.yml. - Grafana – The image is grafana/grafana and is named
dev_grafana_test, you can also change them name of this one, if you want to. It’s populated on port30091and the data for grafana is mounted to/grafana/data.
As you might have noticed, we need a configuration file for Prometheus to run. We have told the compose file that it has been mounted inside /prom/ of the root directory, so let’s go ahead and make that file. Below is the YAML code needed to scrape metrics from the API we will be creating in minutes.
Create Prometheus Configuration
global:
  scrape_interval: 15s
  scrape_timeout: 10s
  evaluation_interval: 15s
alerting:
  alertmanagers:
  - scheme: http
    timeout: 10s
    api_version: v1
    static_configs:
    - targets: []
scrape_configs:
- job_name: TrackApiUsage
  honor_timestamps: true
  scrape_interval: 15s
  scrape_timeout: 10s
  metrics_path: /metrics
  scheme: https
  static_configs:
  - targets:
    - localhost:5001
You should now have a root folder named something like TrackApiUsage and inside that folder, you got two sub-folders named prom and grafana and inside grafana you got another one named data. Below is a more graphical representation of the directories and files:
TrackApiUsage
|   docker-compose.yml
|
+---grafana-data
|   \---data
\---prom
        prometheus.yml
Alright – so far so good. Let’s get the two containers created and spun up. Open cmd inside the root directory and enter the following command to get started. (Please remember that you need to have Docker Desktop installed on your computer).
Pull and run the containers
docker-compose up -dIf you go and take a look inside the Docker Desktop application, you can see our two new containers would be listed and running.
If we take a look inside the directories, we would also see that some new folders and files have been automatically created by the containers.
TrackApiUsage
|   docker-compose.yml
|   tree.txt
|
+---grafana-data
|   \---data
|       |   grafana.db
|       |
|       +---alerting
|       |   \---1
|       |           __default__.tmpl
|       |
|       +---csv
|       +---plugins
|       \---png
\---prom
        prometheus.yml
Both containers are running on localhost and can be accessed at their representative ports. If you click the links below, they would take you to the applications on your local computer.
- Prometheus –> http://localhost:30090
- Grafana –> http://localhost:30091
The metrics collector and graphical representation of them are now in place, but we got no data so far as we don’t have an API exposed on port 5001. Let’s go ahead and make that.
Create a sample .NET Core API in 5 minutes
Go to your root directory and open cmd inside that directory and enter the following line to create a new Sample API based on a template.
dotnet new webapi -o SampleApiBy default, a random port will be specified for the API. We need to change that in order to make Prometheus grab the metrics exposed by the API. Navigate to \TrackApiUsage\SampleApi\Properties and edit launchSettings.json in Visual Studio Code or something similar.
{
  "$schema": "https://json.schemastore.org/launchsettings.json",
  "iisSettings": {
    "windowsAuthentication": false,
    "anonymousAuthentication": true,
    "iisExpress": {
      "applicationUrl": "http://localhost:5000",
      "sslPort": 44353
    }
  },
  "profiles": {
    "SampleApi": {
      "commandName": "Project",
      "dotnetRunMessages": true,
      "launchBrowser": true,
      "launchUrl": "swagger",
      "applicationUrl": "http://localhost:5000",
      "environmentVariables": {
        "ASPNETCORE_ENVIRONMENT": "Development"
      }
    },
    "IIS Express": {
      "commandName": "IISExpress",
      "launchBrowser": true,
      "launchUrl": "swagger",
      "environmentVariables": {
        "ASPNETCORE_ENVIRONMENT": "Development"
      }
    }
  }
}
In line 17 I have updated the “applicationUrl” to be running at http://localhost:5000 instead of the randomly assigned port.
Update program.cs to not redirect to https url. (Only for demo purposes)
using Prometheus;

var builder = WebApplication.CreateBuilder(args);

// Add services to the container.

builder.Services.AddControllers();
// Learn more about configuring Swagger/OpenAPI at https://aka.ms/aspnetcore/swashbuckle
builder.Services.AddEndpointsApiExplorer();
builder.Services.AddSwaggerGen();

var app = builder.Build();

// Configure the HTTP request pipeline.
if (app.Environment.IsDevelopment())
{
    app.UseSwagger();
    app.UseSwaggerUI();
}

app.UseAuthorization();

app.MapControllers();

app.Run();
Run the API
Let’s boot up the API and confirm that it’s running at port 5000 as we just changed it to. Go to the SampleApi folder and enter the following command to run the API inside the console.
dotnet runAwesome! The API is running on port 5000.
Implement Prometheus in .NET Core API
Open a cmd window inside the SampleApi folder and install the Prometheus package inside the project.
dotnet add package prometheus-net.AspNetCoreNow that we got the required dependency in place, let’s go ahead and add the required lines of code to our program.cs inside SampleApi.
Add Prometheus to program.cs and start exposing metrics
Inside program.cs add the following lines of code, that I have added on lines 21, 22, and 28:
using Prometheus;
var builder = WebApplication.CreateBuilder(args);
// Add services to the container.
builder.Services.AddControllers();
// Learn more about configuring Swagger/OpenAPI at https://aka.ms/aspnetcore/swashbuckle
builder.Services.AddEndpointsApiExplorer();
builder.Services.AddSwaggerGen();
var app = builder.Build();
// Configure the HTTP request pipeline.
if (app.Environment.IsDevelopment())
{
app.UseSwagger();
app.UseSwaggerUI();
}
app.UseRouting();
app.UseHttpMetrics();
app.UseAuthorization();
app.MapControllers();
app.MapMetrics();
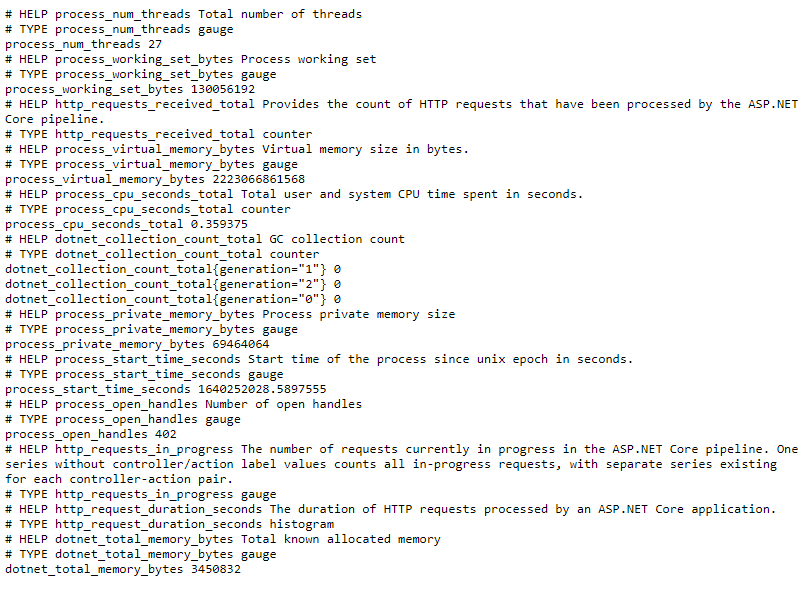
app.Run();Let’s build and run the API one more time and verify that the metrics are being generated. Go to http://localhost:5000/metrics and check that the metrics data are there, like below:
Let’s also verify that Prometheus can see our endpoint and the data. Go to http://localhost:30090/targets and check if the endpoint is up.
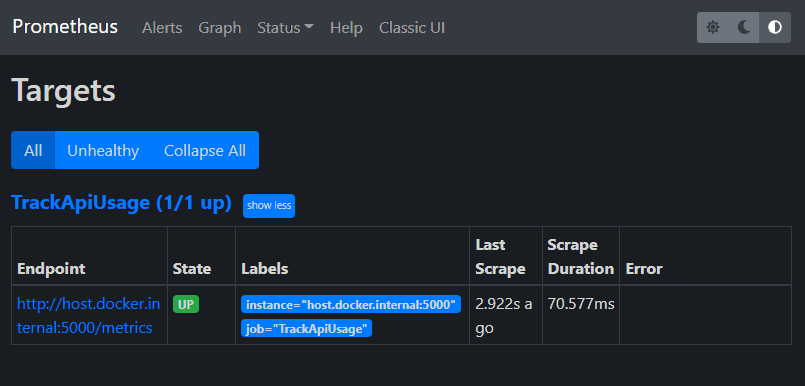
Great! It’s up and running and Prometheus is capable of seeing it. Now let’s generate some test data for it that will be shown inside Grafana.
Use Swagger to create some metrics for Grafana
The API template we just generated with the console comes with built-in support for Swagger. This gives us an easy way to test the built-in Weather API endpoint in our application. Navigate to http://localhost:5000/swagger/index.html and try out the weather endpoint.
Verify newly generated metrics by endpoint
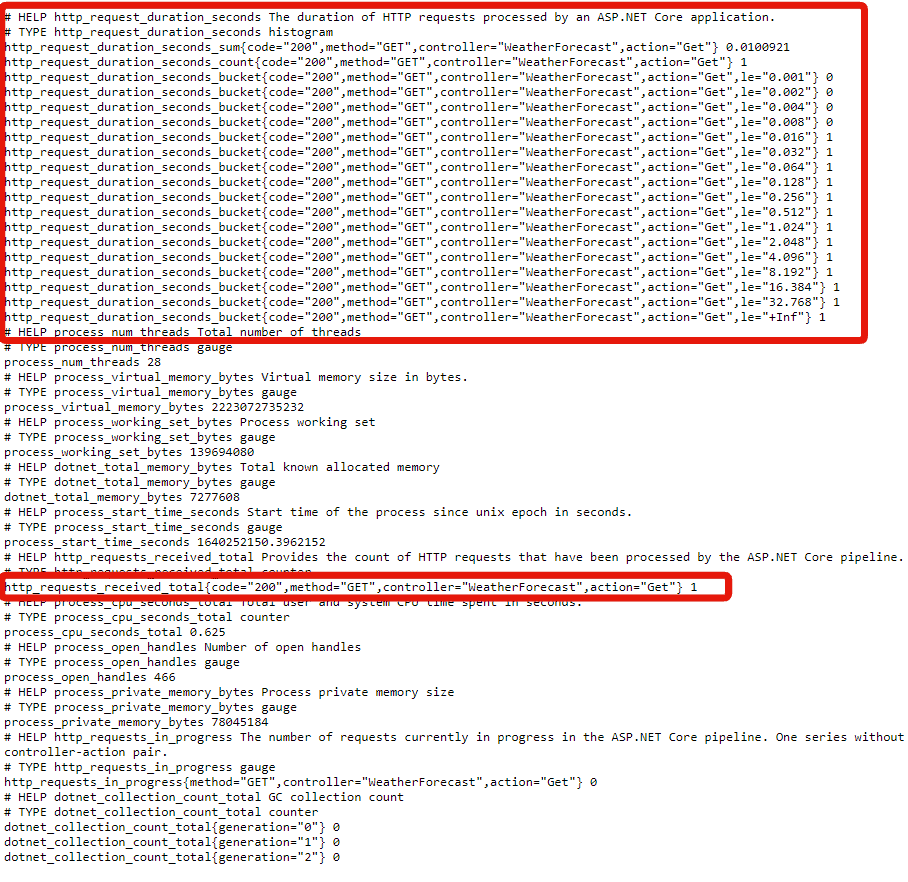
If you navigate to http://localhost:5000/metrics you should now be able to see that metrics for the request have been generated. Just like below, where I have marked the metrics:
We can also verify that Prometheus has picked up our metrics and processed them. Navigate to http://localhost:30090/graph and select the tab named Graph.
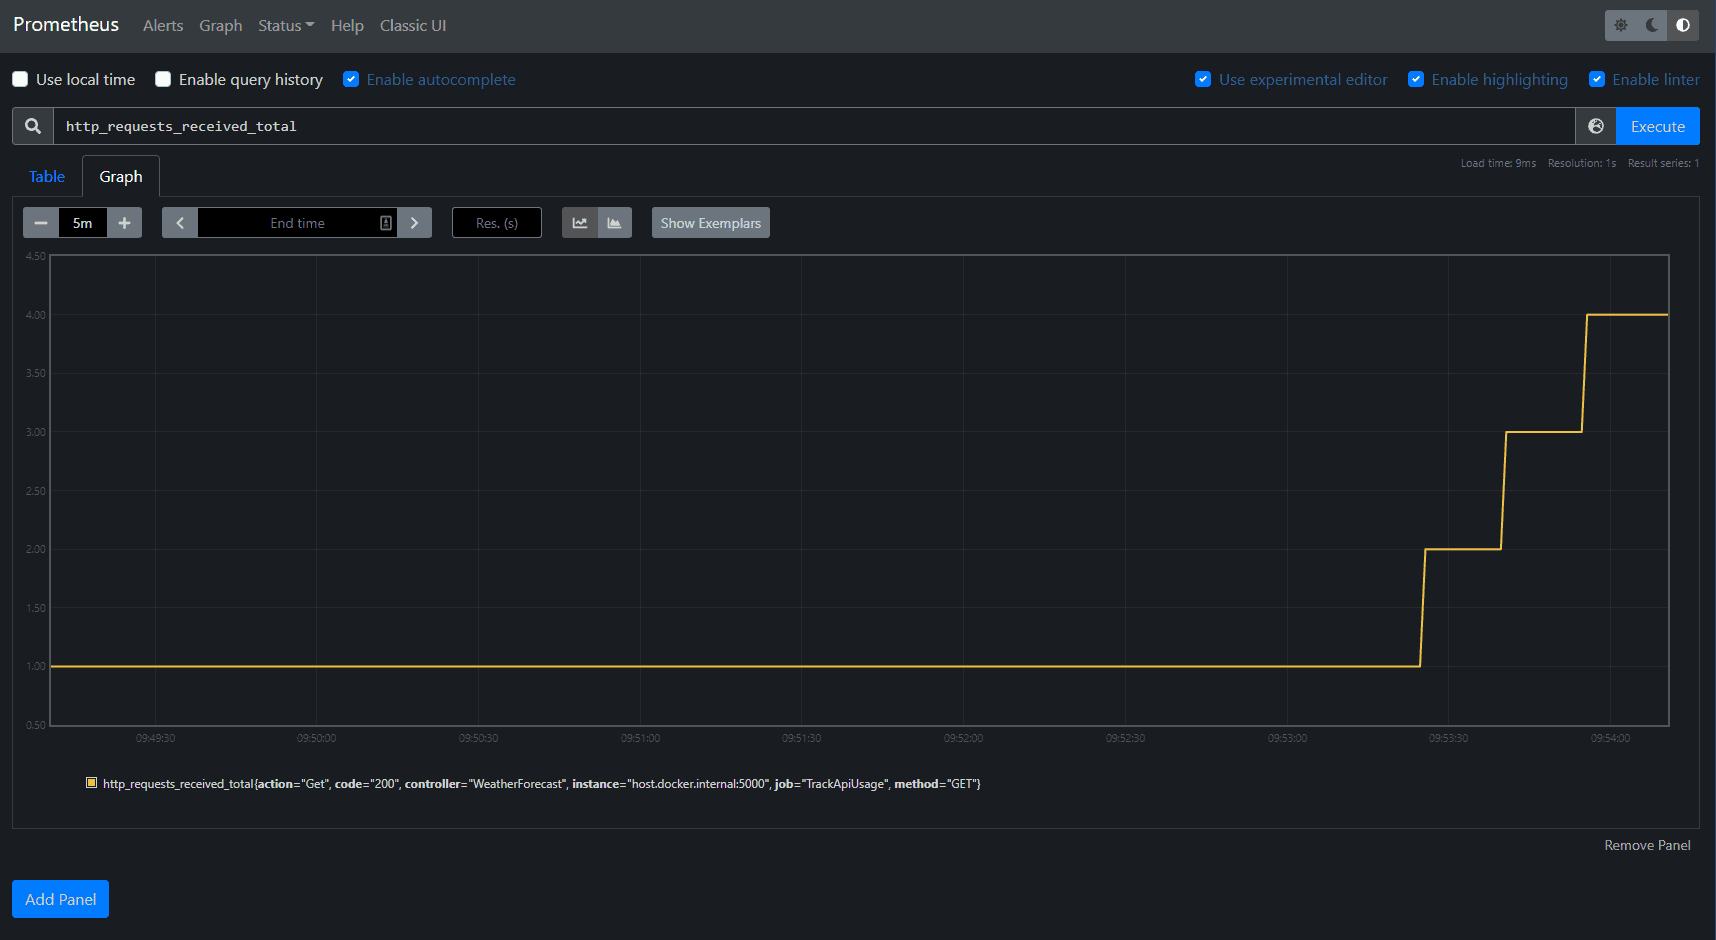
By default, no query has been entered in the Graph panel. You have to enter http_requests_received_total to get the total amount of requests we just made and adjust the timeframe to be 5m instead of 1h.
As you can see above, the data has been transformed into a graph. With that in place, let’s move on to the configuration of Grafana.
Configure Grafana to visualize API usage
Start off by navigating to http://localhost:30091 and log in using default login credentials for Grafana:
- Username –> admin
- Password –> admin
You might have to configure a new password for the user. Please use an easy one, as this is just a demo. If you are doing this for a production environment, then pick a strong one.
Add Prometheus as a new data source
Hover your mouse at the gear icon in the left menu and select Data sources. This will open a new page, where you can add a new data source. Fill the fields, as I have done below:
The URL you have to use is: http://host.docker.internal:30090.
With the new data source in place, let’s add a new dashboard and add a new panel where we can add the query parameters.
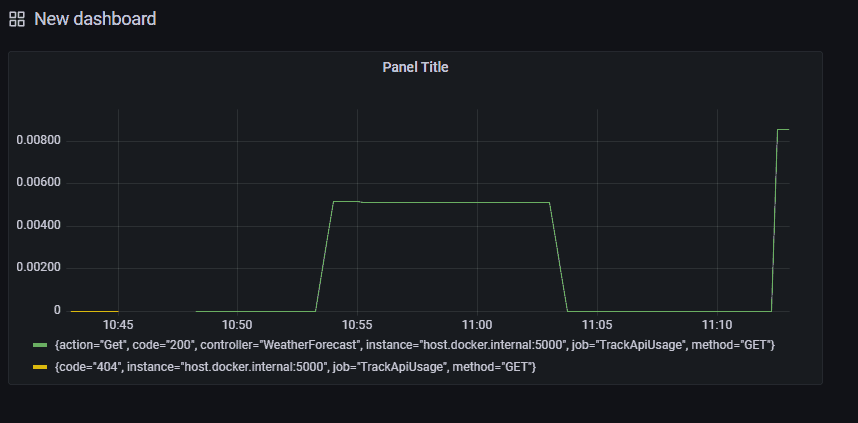
Below is a video teaching you how to add a new dashboard and query the same data as we did earlier in Prometheus:
The query I entered to retrieve the same data as in Prometheus is: rate(http_requests_received_total[15m]). By adding 15min the end as a parameter, we can get data only for the past 15 minutes.
Remember to save the dashboard when you are done.
And there you have it – a Grafana Dashboard showing you metrics from your .NET Core Web API – how cool is that?
Summary
In this tutorial, you learned how to create a docker-compose file in order to get Prometheus and Grafana up and running. You also learned how to mount data inside the application to a drive on the computer – this is good if you like us have something you want to persist that should not be changed on updated etc.
You also learned how to create a .NET Core Web API using a template from the Command Line Interface (CLI / CMD) and how to change the startup properties to avoid HTTPS and specify a specific port.
Last but not least, you also learned how to add a new data source to Grafana and how you can visualize data from the API using a panel in Grafana with a query against Prometheus. Below is a link to the repo, where you can check out the source code.
 Christian-Schou
I hope this tutorial has solved some of your problems and that you now are able to add metrics to all your Web APIs in the future. If you got any suggestions or questions, please let me know in the comments. As always – Happy coding.