Architecture Overview
Before we dig in and get our hands dirty I would like to give you a detailed introduction to the architecture of the Docker Swarm cluster we will be building. It's crucial you know how your hosting environment works. 😅
This Docker Swarm cluster will be a complete hosting environment for production-ready services. I have created a new Docker Image with an API providing the option to generate QR codes. The API outputs metrics for Prometheus that we will visualize with Grafana. This API service will be hosted in our cluster with an SSL certificate, reverse proxy, and security at a top level in front of it. 🔒
I will also show you how to host a blog like this one, using the Ghost CMS software, and how you can spin up a WordPress blog on the same server. Everything that runs in a container can be hosted on this platform and mapped to a domain. Cool right!? 🐋
I will provide you with complete JSON payloads for generating the Grafana dashboards giving you in-depth knowledge about your system and telling you how each of the metrics works and what they visualize.
Overview ✈️
I would like to explain every single part of this solution to give you a much better understanding of what is going on and where. As you read on the first page of this series, we are going to utilize a bunch of technologies to make up our tech stack.
This is a complete overview of our final implementation for Traefik.
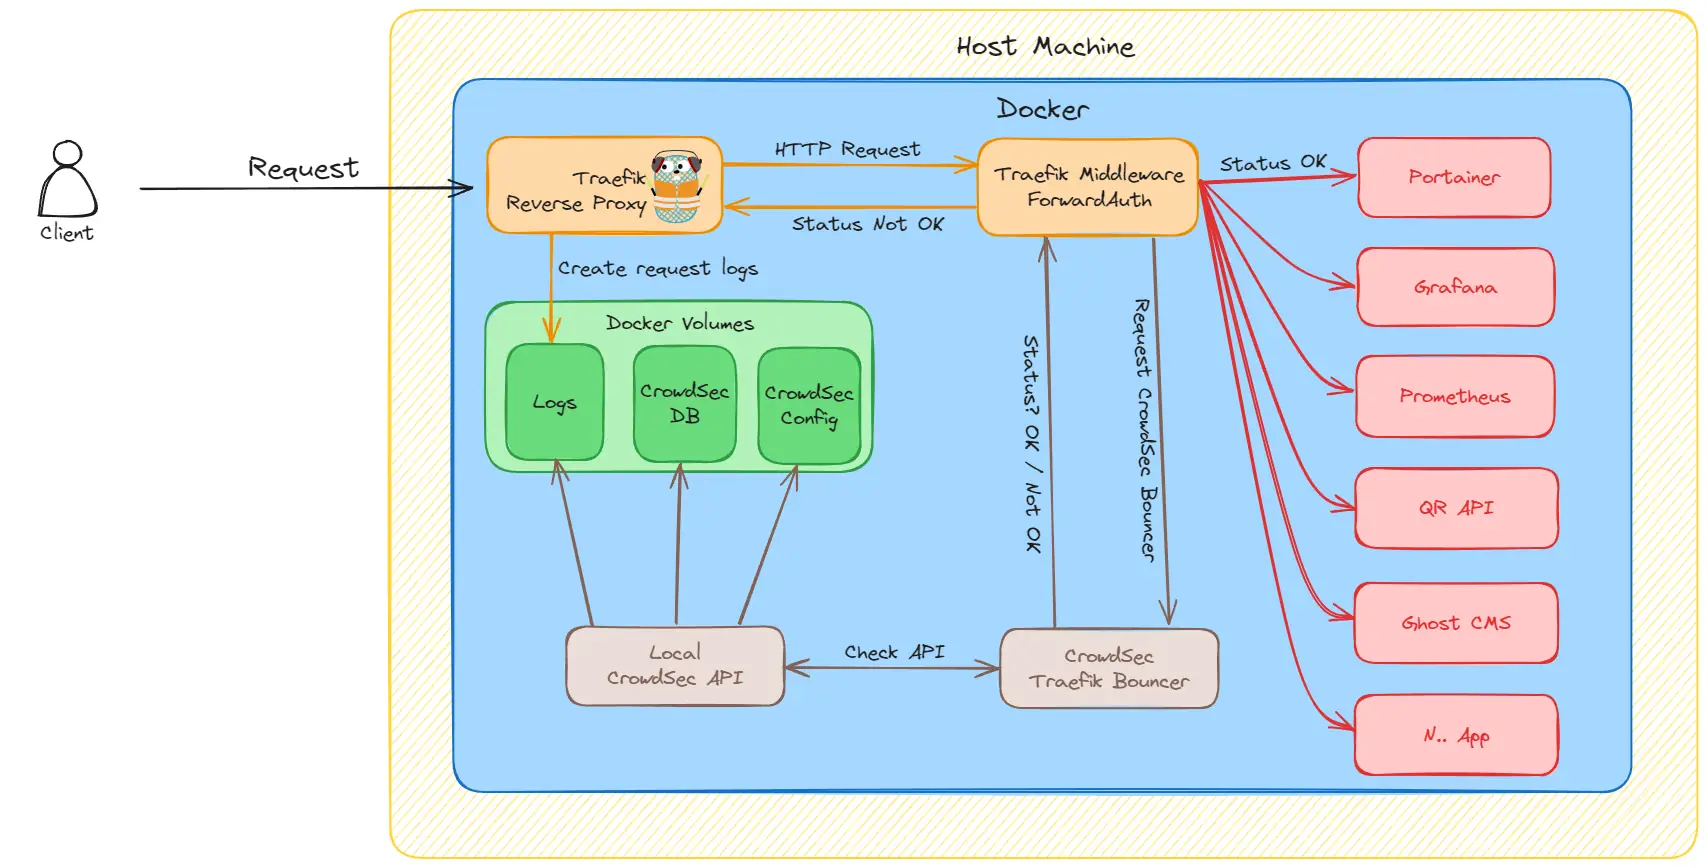
Let me break it down for you into smaller steps 😊
- First, we receive a new request from a client, user, etc...
- Traefik takes care of making sure the request is routed to the correct application and port, thanks to its reverse proxy capabilities. Traefik produces a ton of logs that we store in a docker volume for each request.
- Before the request reaches the app the client requests, it goes through a piece of middleware (CrowdSec).
- The auth middleware will ask our local CrowdSec API (a container) to check if this request should be allowed or rejected. If the CrowdSec algorithm decides this request is not good, it will respond not OK.
- The CrowdSec response is then returned return to the auth middleware (Traefik Bouncer) and an action is made to either pass or reject the request.
I think that should be enough information as of right now. We will dive deep into each section as you move forward in this series.
Metrics 📊
We will be pulling data from each of the services that provide them. I always setup a Prometheus instance to hold my data and some retention, cause I don't need data that is too old, which also just eats my disk space.
We will be monitoring the following parts of our infrastructure.
- Traefik - (uptime, error count, top return codes, avg. response time, requests, etc...)
- CrowdSec - (uptime, resource usage, alerts, parsers, etc...)
- QR API - (uptime, threads, executions, resource usage, etc...)
Below are some screenshots of the dashboards you will end up with. I will explain the data when we reach each of the visualization parts later in this series.
IMAGES HERE
When you are ready, simply go to the next section and get your hands dirty. Now it's time to setup our new server. If you have a server already, then just skip that section.