Metrics
Learn how to power your metrics from Traefik and other services and alert with the leading open-source monitoring solution - Prometheus.

In this section, I will show you how to spin up a stack of monitoring services, including:
- Prometheus - The Prometheus monitoring system and time series database.
- cAdvisor - Analyzes resource usage and performance characteristics of running containers.
- Grafana - The open and composable observability and data visualization platform.
We are going to add all these services under a metrics.your-domain.com/<service> domain. For instance, Grafana would look like this: https://metrics.your-domain.com/grafana. The three services will live in one stack in our cluster for easy deployment of dependency management.
I will show you have to deploy cAdvisor as a global service with multiple replicas, how to deploy Prometheus with configs for scraping services, and how to provision Grafana with pre-configured data sources and dashboard.
All services will be available through our Traefik proxy with path prefixes to the public internet, including basic authentication. If you are ready, then let's get to it! 🚀
In case you missed the last section of this series, where we configured Portainer, you can check it out below ⬇️
The Folder Structure
As we will have three services for our metrics, we need to make sure that we have a proper folder structure in place to keep everything in order.
Create a new folder in the services folder, where the other services already live. It should have the name metrics.
mkdir /srv/docker/services/metrics && cd $_Now make two folders in the metrics folder. One for Prometheus and one for Grafana.
mkdir prometheus
mkdir grafana
cAdvisor dosen't need a folder, at it's just a service we will spin up and extract data from, it doesn't require any config files, etc... like we will create for the two other services.
cAdvisor
The first service we will be looking at is cAdvisor as Prometheus is depending on this service. If you are curious on how the dependens_on feature in Docker Compose works, you can check out my tutorial below.

Before we get to the fun part, let's first take a quick look at what cAdvisor is.
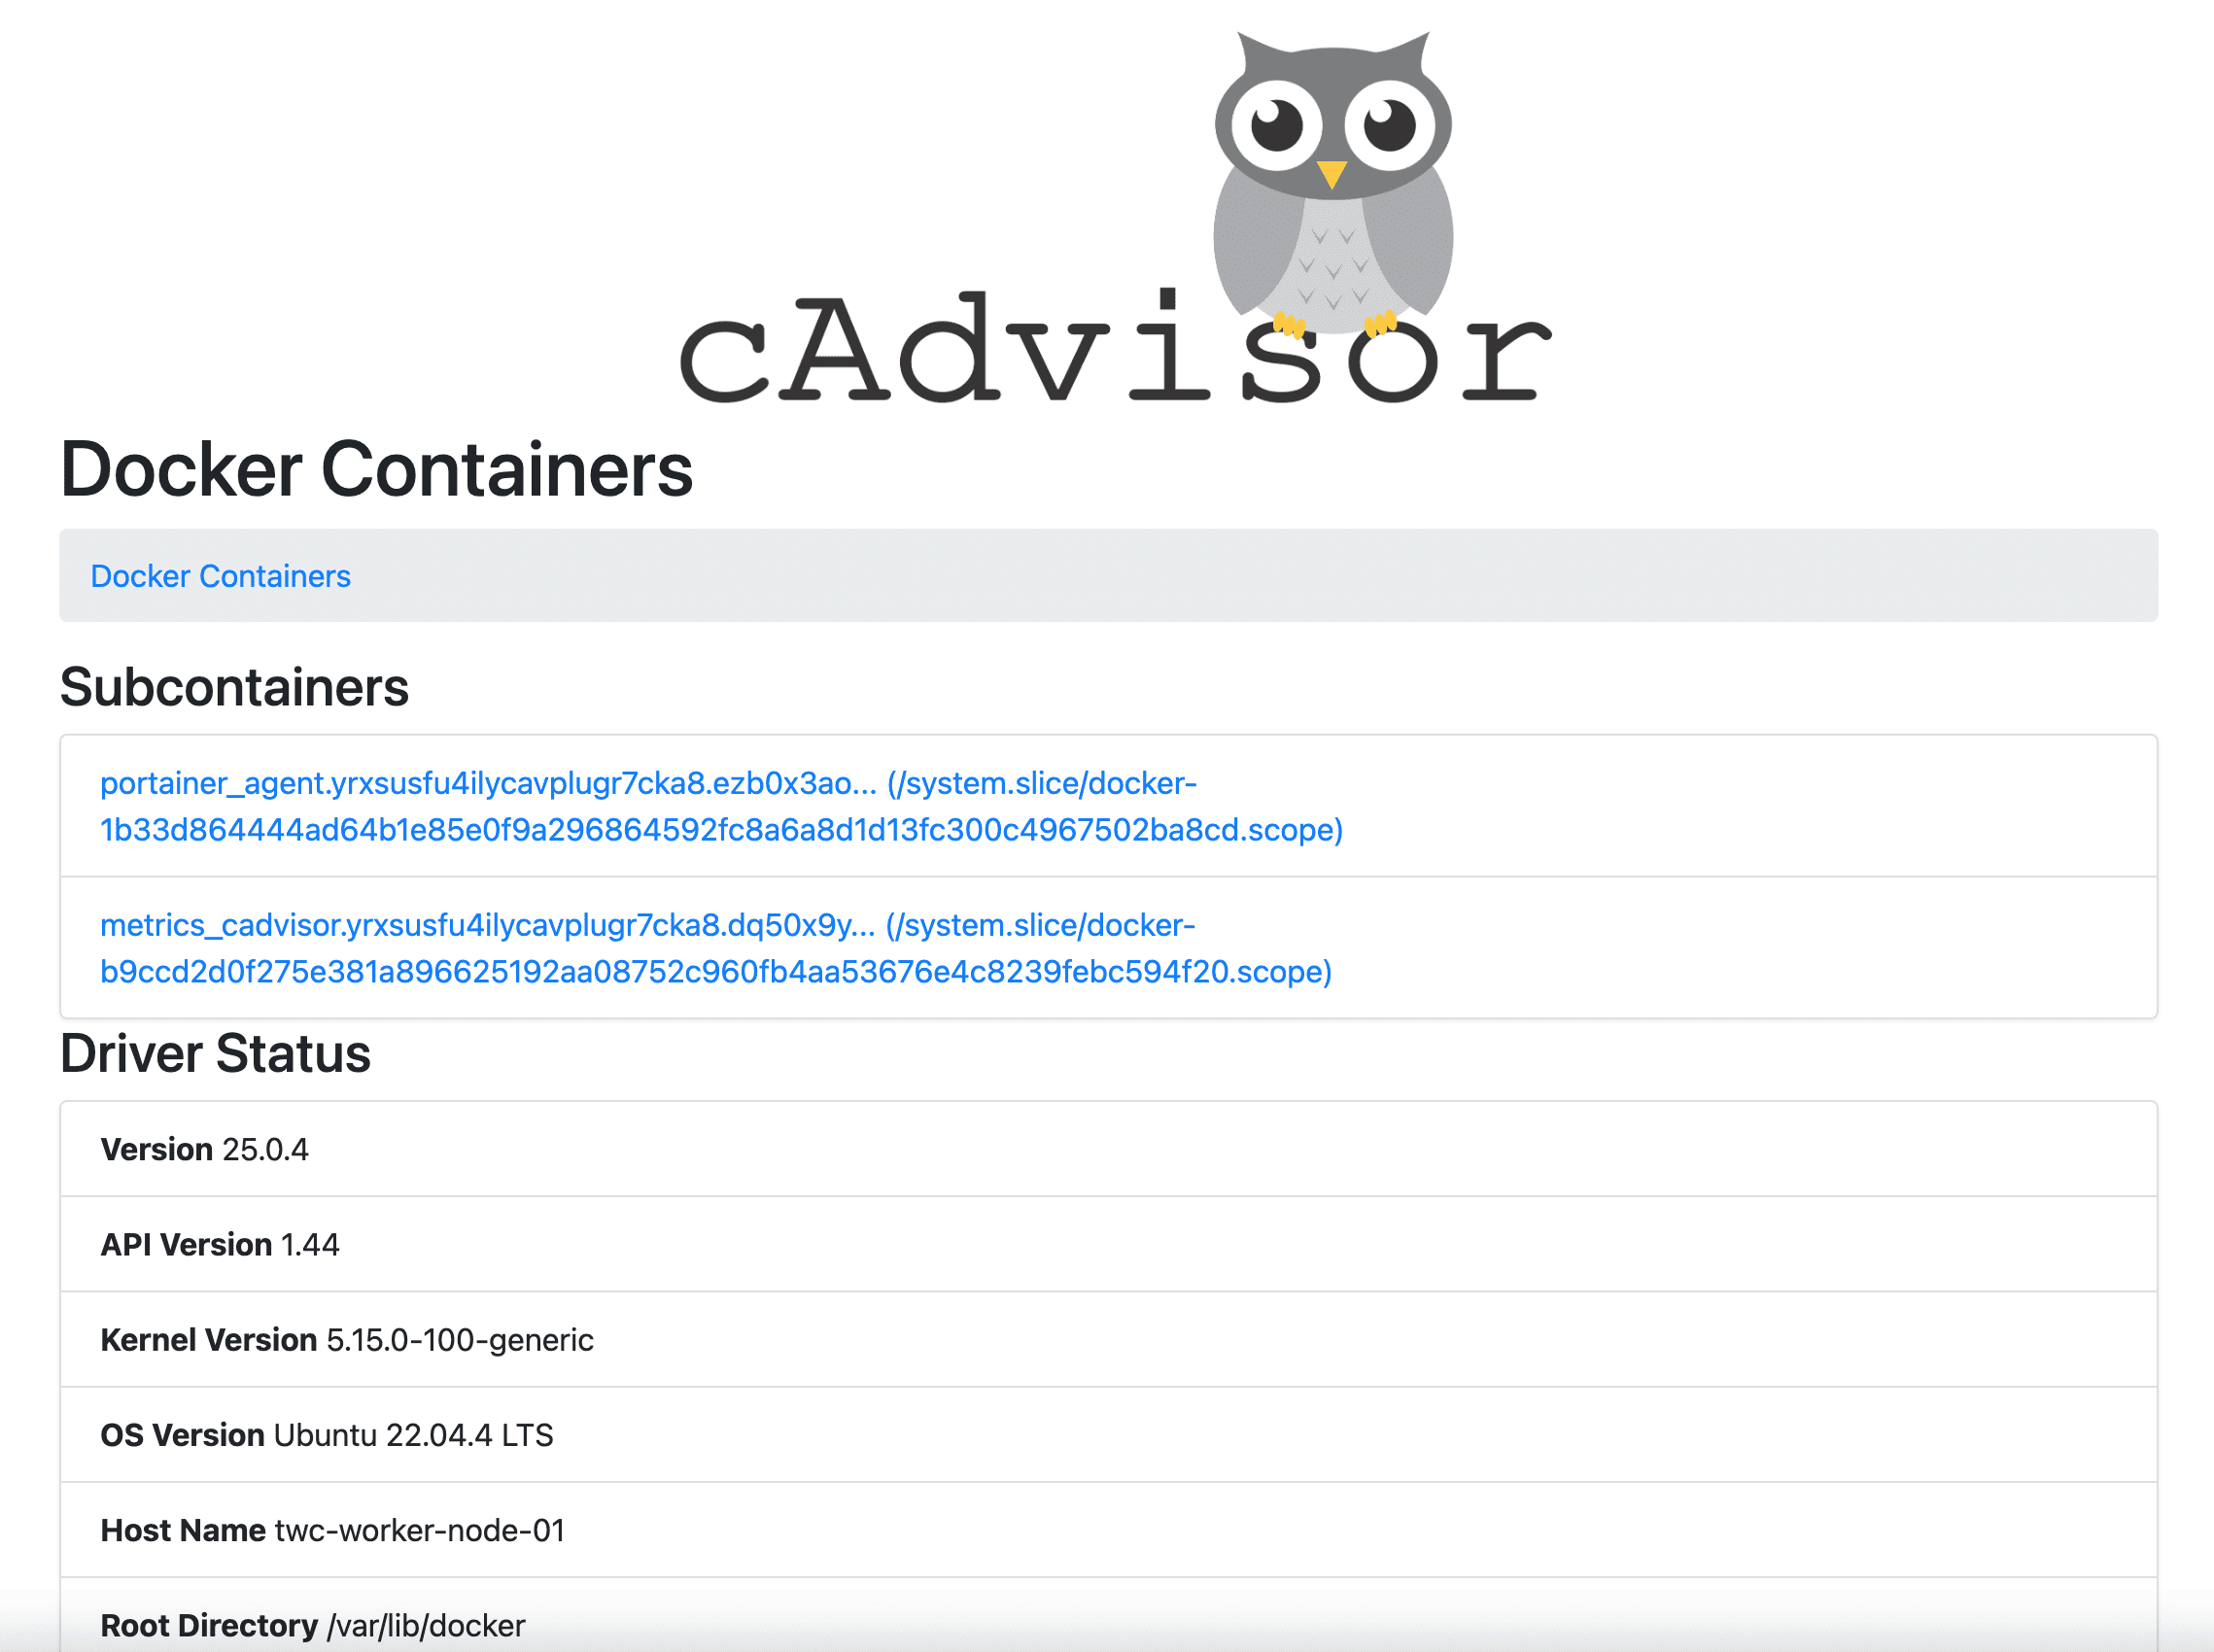
What Is cAdvisor?
 google
cAdvisor, short for Container Advisor, is a crucial tool for container users seeking deeper insights into the resource usage and performance of their running containers.
Operating as a continuous daemon, cAdvisor collects, aggregates, and exports essential information about active containers. From resource isolation parameters to historical usage data and network statistics, cAdvisor provides a comprehensive view, enabling users to optimize their containerized environments effectively.
Deploy cAdvisor Using Docker Compose
It's straight forward deploying cAdvisor in your cluster. We will do it using a Docker Compose file that will contain three three services we will create in this section. cAdvisor will as the one and only be deployed globally in the swarm, as we want to monitor containers across all nodes.
In the root of the metrics folder, create a new file named docker-compose.yml and paste the following content into it.
version: "3.3"

services:
  cadvisor:
    image: gcr.io/cadvisor/cadvisor:v0.49.1
    restart: unless-stopped
    volumes:
      - /:/rootfs:ro
      - /var/run:/var/run:ro
      - /sys:/sys:ro
      - /var/lib/docker/:/var/lib/docker:ro
      - /dev/disk/:/dev/disk:ro
    privileged: true
    devices:
      - "/dev/kmsg:/dev/kmsg"
    command: --url_base_prefix=/cadvisor
    environment:
      - CADVISOR_HEALTHCHECK_URL=http://localhost:8080/cadvisor/healthz
    deploy:
      mode: global
      resources:
        limits:
          cpus: '0.10'
          memory: 128M
        reservations:
          cpus: '0.10'
          memory: 64M
      labels:
        traefik.enable: "true"
        traefik.docker.network: "proxy"
        traefik.http.routers.cadvisor.entrypoints: "https"
        traefik.http.routers.cadvisor.middlewares: "traefikAuth@file,default@file"
        traefik.http.routers.cadvisor.rule: "Host(`metrics.your-domain.com`) && PathPrefix(`/cadvisor`)"
        traefik.http.routers.cadvisor.service: "cadvisor"
        traefik.http.routers.cadvisor.tls.certresolver: "letsEncrypt"
        traefik.http.routers.cadvisor.tls.options: "modern@file"
        traefik.http.routers.cadvisor.tls: "true"
        traefik.http.services.cadvisor.loadbalancer.server.port: 8080
        traefik.http.services.cadvisor.loadbalancer.sticky.cookie.httpOnly: "true"
        traefik.http.services.cadvisor.loadbalancer.sticky.cookie.secure: "true"
    networks:
      - proxy


networks:
  proxy:
    driver: overlay
    external: true
In the compose file above, we have defined a new service named cadvisor using the image gcr.io/cadvisor/cadvisor:v0.49.1. I have added a command to tell cAdvisor that I want it to "live" at /cadvisor when someone makes a request for it's domain.
The deployment is set to be global, this means that we will have one replica on each node in our cluster. I have also specified some resource limits, to make sure it won't eat up all resources in the cluster.
The Traefik labels look like the ones from earlier in the other sections, with a slight twist. I the rule label I am telling trafik that I want to serve this service when someone requests https://metrics.your-domain.com/cadvisor. I don't want to show these data publicly, hence I have added the traefikAuth@file middleware. cAdvisor will by default serve requests at port 8080, and that's why I have configured the loadbalancer port for that. I wan't everything to happen through HTTPS, hence I am telling it to use the letsEncrypt resolver for certificates and TLS.
That's it for cAdvisor. We are not going to spin it up yet, as I want to add the other services before we do the grand finale.
Prometheus
In this section, we will have a look at how we can configure and spin up Prometheus to monitor Traefik and cAdvisor in our Docker Swarm cluster. 👀
Specifically, we will make a configuration file like we did with Traefik earlier, but for Prometheus this time and then add Prometheus in the metrics Docker Compose file to spin up Prometheus in our Docker Swarm.
We will be using the Traefik metrics route and implement the basic auth in the config file to read the data from Traefik and cAdvisor. If you are ready, then let's get to it. 🚀
A Prometheus Primer
Prometheus is 100% open-source and community-driven. All components are available under the Apache 2 License on GitHub. Go check them out and give them a start. They have done a great job! ⭐

How Does Prometheus Work?
Prometheus works by storing all data as a time series. A time series consists of streams of time stamped values belonging to the same metric and the same set of labeled dimensions. Besides stored time series, Prometheus may generate temporary derived time series as the result of queries.
You can read much more about the data model here:
How Can We Harvest Data From Our Prometheus Service?
Prometheus works by having a ton of exporters and integrations that help export existing metrics from third-party systems as Prometheus metrics. This is useful for cases where it is not feasible to instrument a given system with Prometheus metrics directly (for example, HAProxy or Linux system stats).
So yeah... you could monitor metrics from each of your nodes. Let's have a look at that by the end of this series. Let's call it a bonus. 😎 You can check out the exporters at the link below.
Configure Prometheus
Prometheus requires some configuration in order for it to work properly and be able to scrape the /metrics endpoints from Traefik and cAdvisor.
Inside the metrics folder, create a new folder named prometheus, and add a new file named prometheus.yml.
mkdir prometheus && cd $_ && nano prometheus.ymlPaste the following configuration content inside it, and save it. ctrl + o.
global:
  scrape_interval: 15s                               # How frequently to scrape targets by default.
  scrape_timeout: 10s                                # How long until a scrape request times out.
  evaluation_interval: 15s                           # How frequently to evaluate rules.

alerting:
  alertmanagers:
  - static_configs:
    - targets: []
    scheme: https
    timeout: 10s
    api_version: v1

scrape_configs:                                      # https://prometheus.io/docs/prometheus/latest/configuration/configuration/#scrape_config

  - job_name: traefik
    scrape_interval: 20s
    scrape_timeout: 10s
    metrics_path: /
    honor_timestamps: true
    scheme: https
    static_configs:
      - targets:
          - traefik-metrics.your-domain.com
    basic_auth:
      username: admin
      password: Welcome2024!

  - job_name: cadvisor
    metrics_path: /cadvisor/metrics
    honor_timestamps: true
    scheme: https
    static_configs:
      - targets:
          - metrics.your-domain.com
    basic_auth:
      username: admin
      password: Welcome2024!
This is a basic configuration for Prometheus. You can define your own alerts if you want to, I have prepared the file for it. I would recommend you to use environment variables for the username and password, as storing those as clear-text is generally not good practice.
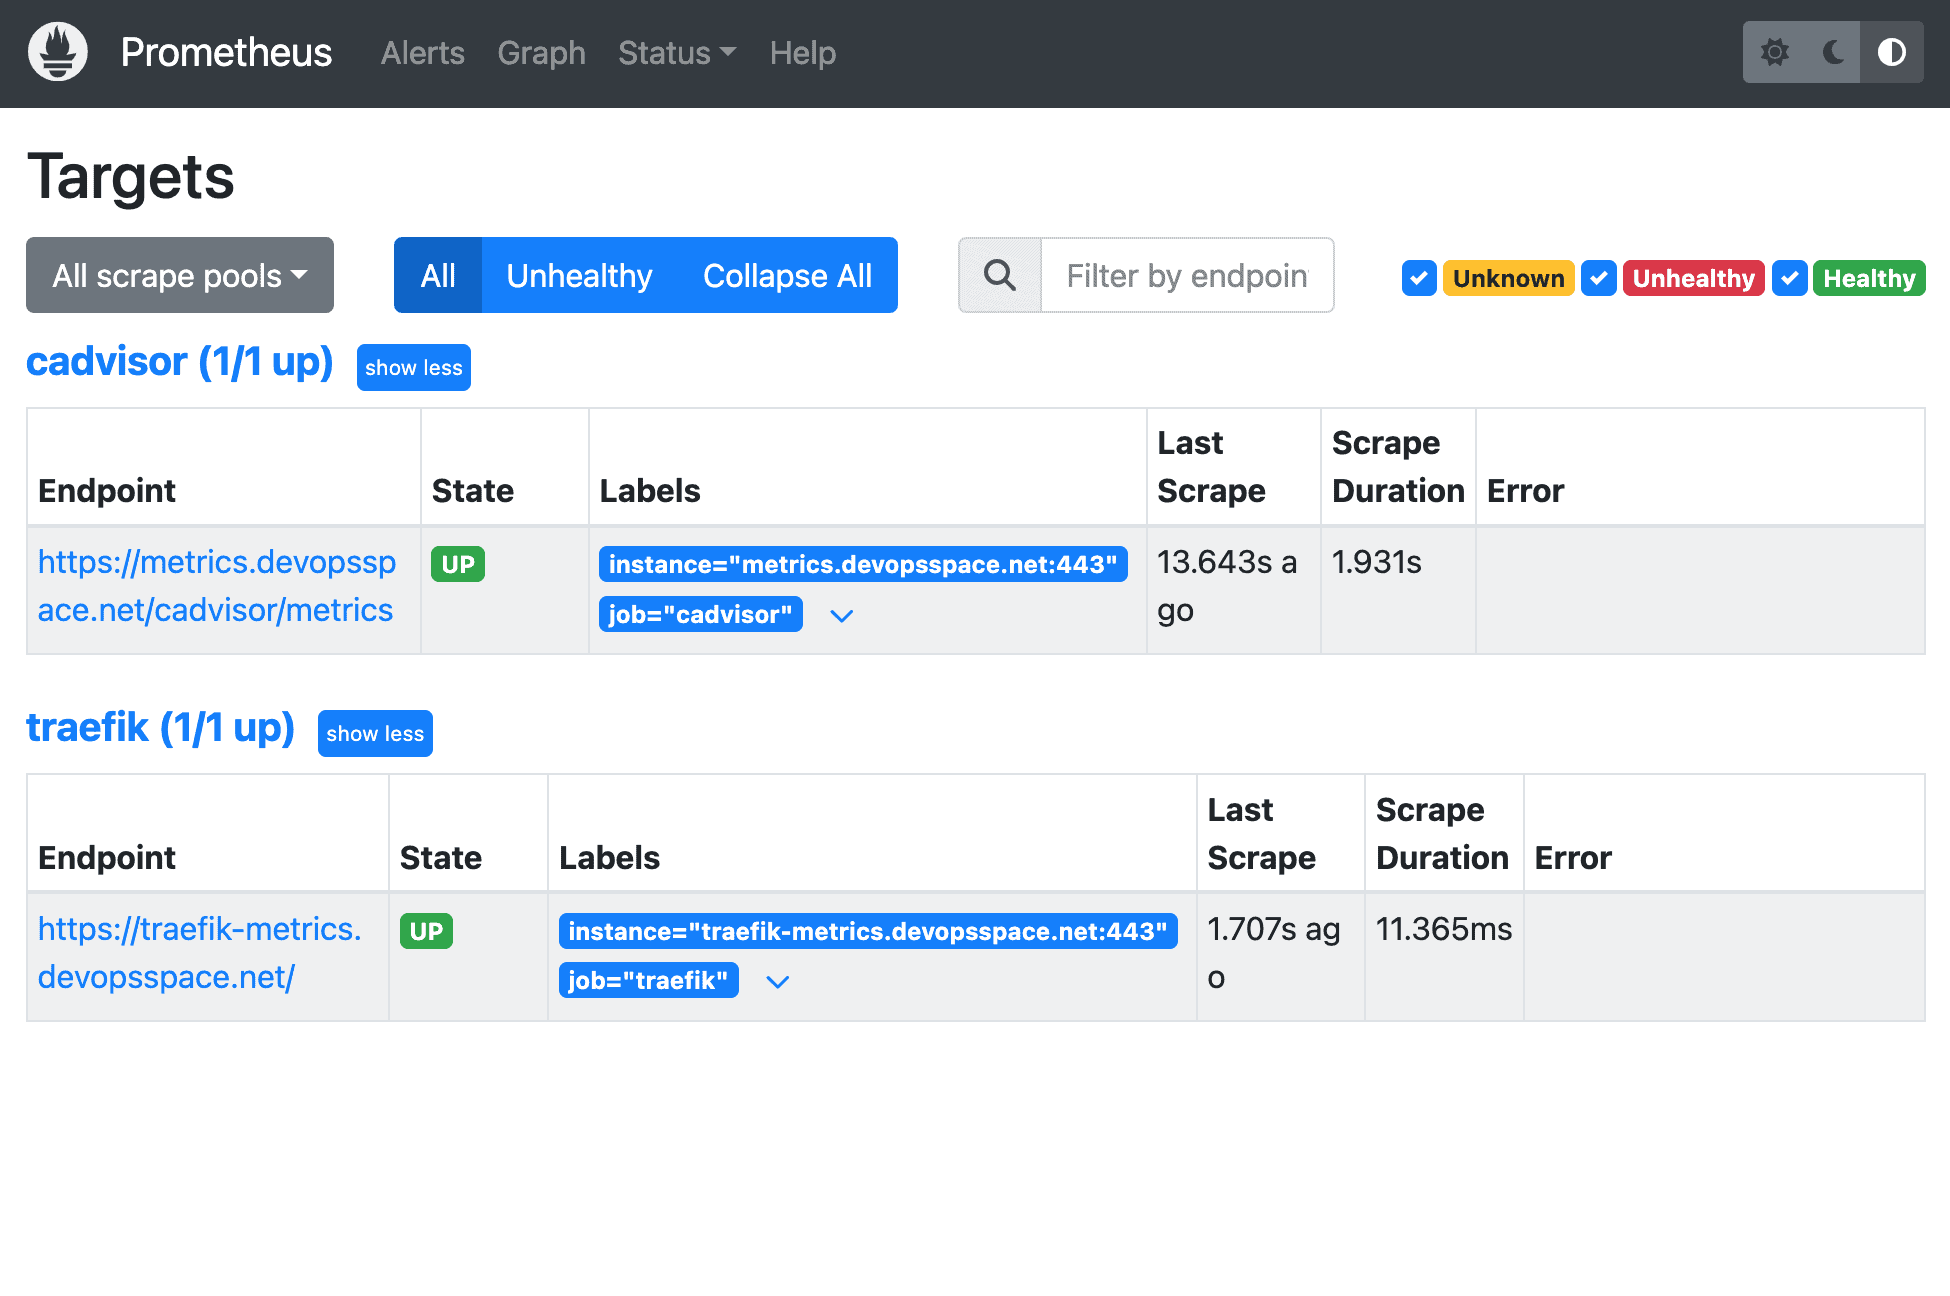
As you can see we have two scrape jobs. The first job is for Traefik at the traefik-metrics.your-domain.com we configured in the compose file for Traefik earlier.
I have added basic auth on both of them, with the credentials we specified in the string for auth in the middleware we configured earlier. Please use env. variables or secrets instead, as it's more secure. I will show you how later, when we reach the security section of this series later.
Spin Up The Prometheus Service
Okay, let's get started with the fun part of this section. It's time to write the deployment configuration for Prometheus in our Docker Swarm Cluster.
In the services folder /srv/docker/services/metrics we are going to add to the already existing docker-compose.yml file. This is the contents that we will add below the already existing cAdvisor service.
version: "3.3"

services:
  cadvisor:
    image: gcr.io/cadvisor/cadvisor:v0.49.1
    restart: unless-stopped
    volumes:
      - /:/rootfs:ro
      - /var/run:/var/run:ro
      - /sys:/sys:ro
      - /var/lib/docker/:/var/lib/docker:ro
      - /dev/disk/:/dev/disk:ro
    privileged: true
    devices:
      - "/dev/kmsg:/dev/kmsg"
    command: --url_base_prefix=/cadvisor
    environment:
      - CADVISOR_HEALTHCHECK_URL=http://localhost:8080/cadvisor/healthz
    deploy:
      mode: global
      resources:
        limits:
          cpus: '0.10'
          memory: 128M
        reservations:
          cpus: '0.10'
          memory: 64M
      labels:
        traefik.enable: "true"
        traefik.docker.network: "proxy"
        traefik.http.routers.cadvisor.entrypoints: "https"
        traefik.http.routers.cadvisor.middlewares: "traefikAuth@file,default@file"
        traefik.http.routers.cadvisor.rule: "Host(`metrics.your-domain.com`) && PathPrefix(`/cadvisor`)"
        traefik.http.routers.cadvisor.service: "cadvisor"
        traefik.http.routers.cadvisor.tls.certresolver: "letsEncrypt"
        traefik.http.routers.cadvisor.tls.options: "modern@file"
        traefik.http.routers.cadvisor.tls: "true"
        traefik.http.services.cadvisor.loadbalancer.server.port: 8080
        traefik.http.services.cadvisor.loadbalancer.sticky.cookie.httpOnly: "true"
        traefik.http.services.cadvisor.loadbalancer.sticky.cookie.secure: "true"
    networks:
      - proxy

  prometheus:
    image: prom/prometheus:v2.50.1
    restart: unless-stopped
    networks:
      - proxy
    volumes:
      - ./prometheus:/etc/prometheus
      - prometheus_data:/prometheus
      - /var/run/docker.sock:/var/run/docker.sock:ro
    command:
      - '--config.file=/etc/prometheus/prometheus.yml'
      - '--storage.tsdb.path=/prometheus'
      - '--storage.tsdb.retention.size=256MB'
      - '--web.external-url=/prometheus/'
      - '--web.route-prefix=/prometheus/'
    depends_on:
      - cadvisor
    deploy:
      placement:
        constraints:
          - node.role == manager
      labels:
        traefik.enable: "true"
        traefik.docker.network: "proxy"
        traefik.http.routers.prometheus.rule: "Host(`metrics.your-domain.com`) && PathPrefix(`/prometheus`)"
        traefik.http.routers.prometheus.entrypoints: "https"
        traefik.http.routers.prometheus.service: "prometheus"
        traefik.http.routers.prometheus.tls.certresolver: "letsEncrypt"
        traefik.http.routers.prometheus.tls.options: "modern@file"
        traefik.http.routers.prometheus.tls: "true"
        traefik.http.services.prometheus.loadbalancer.server.port: 9090

networks:
  proxy:
    driver: overlay
    external: true

volumes:
  prometheus_data:
What did we just add? 🤔
We have now added prometheus as a service in our Docker Compose file, just beneath the cadvisor service. I have told it to restart automatically unless I stop it manually. The network is set to the proxy network, as we want to be able to reach it from the outside through Traefik.
For the volumes, I have mapped the prometheus folder we created before, that contains our prometheus.yml configuration file for Prometheus. I have also mounted a new volume prometheus_data, that I have defined at the bottom of this file, where Prometheus can store it's application data.
Next up is a set of commands, where we tell Prometheus to:
- Load the configuration from the config file we mounted in.
- The storage path and maximum size of data we want to store is set to
/prometheus(will be located at the mounted volumeprometheus_data) and256MB, as I don't have a ton of storage on this server. - Finally, we tell Prometheus that we wan't to access it on a prefixed path. In this example, we would like Prometheus to serve all requests at
/prometheus/*.
I have added a depends_on constraint that instructs it for waiting for cAdvisor to report a healthy state. By doing this we ensure that we won't get a down error in Prometheus for cAdvisor metrics data.
Finally, we have the deploy section. It looks a lot like the other Traefik labels, except that Prometheus will handle requests at port 9090. We have added basic auth in front of it using the middleware we created in our Traefik config, and told Traefik that we want to service requests at the path metrics.your-domain.com/prometheus.
At the very end I have defined a volume named prometheus_data, where Prometheus can store its data for real persistence in case reboots happens at the server.
We are still not spinning up the Stack, we are missing Grafana. Let's add that along with some provisioning files for a Traefik dashboard and our Prometheus data source.
Grafana
Quick Grafana Introduction
Grafana allows you to query, visualize, alert on and understand your metrics no matter where they are stored. You can easily create, explore, and share dashboards with your team and foster a data-driven culture in your team, organization, etc.
grafanaI personally think that Grafana is a great choice for visualizing metrics, as it provides a great interface, as it got a lot of options for data sources and provides an option for you to re-use others dashboards and plugins.
I use Grafana to visualize insights from my own API's and services both in production and test. You can also configure alerts in Grafana and set it up to send notifications or trigger webhooks in case of troubles, it's simply awesome!
Provision A Data source And Dashboard For Grafana With Config Files
I am that kind of guy who likes to define my infrastructure using code (IaC), and we are going to just that for Grafana.
Inside the metrics folder, create a new folder named grafana, and then create a new folder inside that named provisioning.
mkdir grafana && cd grafanaThe provisioning folder is going to contain two more folders. Let's create both of them.
mkdir datasources && mkdir dashboardsBefore we make any provisioning files, let's start by creating a custom.ini file in the provisioning folder. Paste the following content inside it.
[security]

admin_user = admin
admin_password = Welcome2024!

[server]
domain = metrics.your-domain.com
root_url = %(protocol)s://%(domain)s:%(http_port)s/grafana/
serve_from_sub_path = true
What is going on here? 🤔
I have defined a section for security and the server. This file can be used to configure Grafana inside the container (service). Basically, it will tell Grafana to create the admin account with the above admin credentials.
The server section instructs Grafana about the domain, where we will be hosting the service and then define a path prefix like we did with Prometheus and cAdvisor. Finally, we tell it to serve its great contents from the sub path. You can read much more about how this custom.ini file can be configured on the link below.


Alright, go to the datasources folder and create a new file named datasource_prometheus.yml and paste the following content inside it.
apiVersion: 1

datasources:

  - name: Prometheus
    isDefault: true
    type: prometheus
    access: proxy
    url: http://metrics.devopsspace.net/prometheus
    editable: true
    basicAuth: true
    basicAuthUser: admin
    secureJsonData:
      basicAuthPassword: Welcome2024!
This will create a new data source for Prometheus with the details we have used earlier. When we launch prometheus now in our Docker Stack for the metrics services, Prometheus will already be configured and ready to use!
Now go to the dashboards folder and create a new folder named definitions. Before we make any definitions inside that folder, let's create a file named dashboard_traefik.yml in the dashboards folder, and paste the following inside that file.
apiVersion: 1

providers:
  - name: 'Traefik Dashboard'
    folder: Traefik
    type: file
    disableDeletion: true
    editable: true
    updaterIntervalSeconds: 15
    allowUiUpdates: true
    options:
      path: /var/lib/grafana/dashboards/traefik
This is a config that instructs Grafana to pickup a dashboard from the /var/lib/grafana/traefik folder inside the container and name it Traefik Dashboard and put it in a folder named Traefik. We will mount the dashboard into that folder in the compose file in a moment.
Now in the definitions folder, create a new file named dashboard_traefik.json and put the JSON code from this file inside it.
That's it for the configurations of Grafana. Let's go back to the metrics folder, where we have the Docker Compose file for the metrics services.
Spin Up The Grafana Service
Finally, the last but not least service in our metrics stack. Grafana! 📈 Let's visualize some data from our metrics providers.
Inside the already existing docker-compose.yml file, add the following content at the bottom to create the grafana service. Remember to add the new grafana_data volume as well.
version: "3.3"

services:
  cadvisor:
    image: gcr.io/cadvisor/cadvisor:v0.49.1
    restart: unless-stopped
    volumes:
      - /:/rootfs:ro
      - /var/run:/var/run:ro
      - /sys:/sys:ro
      - /var/lib/docker/:/var/lib/docker:ro
      - /dev/disk/:/dev/disk:ro
    privileged: true
    devices:
      - "/dev/kmsg:/dev/kmsg"
    command: --url_base_prefix=/cadvisor
    environment:
      - CADVISOR_HEALTHCHECK_URL=http://localhost:8080/cadvisor/healthz
    deploy:
      mode: global
      resources:
        limits:
          cpus: '0.10'
          memory: 128M
        reservations:
          cpus: '0.10'
          memory: 64M
      labels:
        traefik.enable: "true"
        traefik.docker.network: "proxy"
        traefik.http.routers.cadvisor.entrypoints: "https"
        traefik.http.routers.cadvisor.middlewares: "traefikAuth@file,default@file"
        traefik.http.routers.cadvisor.rule: "Host(`metrics.your-domain.com`) && PathPrefix(`/cadvisor`)"
        traefik.http.routers.cadvisor.service: "cadvisor"
        traefik.http.routers.cadvisor.tls.certresolver: "letsEncrypt"
        traefik.http.routers.cadvisor.tls.options: "modern@file"
        traefik.http.routers.cadvisor.tls: "true"
        traefik.http.services.cadvisor.loadbalancer.server.port: 8080
        traefik.http.services.cadvisor.loadbalancer.sticky.cookie.httpOnly: "true"
        traefik.http.services.cadvisor.loadbalancer.sticky.cookie.secure: "true"
    networks:
      - proxy

  prometheus:
    image: prom/prometheus:v2.50.1
    restart: unless-stopped
    networks:
      - proxy
    volumes:
      - ./prometheus:/etc/prometheus
      - prometheus_data:/prometheus
      - /var/run/docker.sock:/var/run/docker.sock:ro
    command:
      - '--config.file=/etc/prometheus/prometheus.yml'
      - '--storage.tsdb.path=/prometheus'
      - '--storage.tsdb.retention.size=256MB'
      - '--web.external-url=/prometheus/'
      - '--web.route-prefix=/prometheus/'
    depends_on:
      - cadvisor
    deploy:
      placement:
        constraints:
          - node.role == manager
      labels:
        traefik.enable: "true"
        traefik.docker.network: "proxy"
        traefik.http.routers.prometheus.rule: "Host(`metrics.your-domain.com`) && PathPrefix(`/prometheus`)"
        traefik.http.routers.prometheus.entrypoints: "https"
        traefik.http.routers.prometheus.service: "prometheus"
        traefik.http.routers.prometheus.tls.certresolver: "letsEncrypt"
        traefik.http.routers.prometheus.tls.options: "modern@file"
        traefik.http.routers.prometheus.tls: "true"
        traefik.http.services.prometheus.loadbalancer.server.port: 9090

  grafana:
    image: grafana/grafana:10.3.5
    depends_on:
      - prometheus
    restart: unless-stopped
    volumes:
      - grafana_data:/var/lib/grafana
      - ./grafana/provisioning/:/etc/grafana/provisioning/
      - ./grafana/provisioning/custom.ini:/etc/grafana/grafana.ini
      - type: bind
        source: ./grafana/provisioning/dashboards/definitions/dashboard_traefik.json
        target: /var/lib/grafana/dashboards/traefik/traefik-dashboard.json
    environment:
      - GF_INSTALL_PLUGINS=grafana-piechart-panel,grafana-worldmap-panel
    networks:
      - proxy
    deploy:
      labels:
        traefik.enable: "true"
        traefik.docker.network: "proxy"
        traefik.http.routers.grafana.entrypoints: "https"
        traefik.http.routers.grafana.middlewares: "default@file"
        traefik.http.routers.grafana.rule: "Host(`metrics.your-domain.com`) && PathPrefix(`/grafana`)"
        traefik.http.routers.grafana.service: "grafana"
        traefik.http.routers.grafana.tls.certresolver: "letsEncrypt"
        traefik.http.routers.grafana.tls.options: "modern@file"
        traefik.http.routers.grafana.tls: "true"
        traefik.http.services.grafana.loadbalancer.server.port: 3000
      placement:
        constraints:
          - node.role == manager

networks:
  proxy:
    driver: overlay
    external: true

volumes:
  prometheus_data:
  grafana_data:
Above is the final docker-compose.yml file to create and pin up all our metrics services for our cluster as of now. But what did we just add? 🤔
We have defined a new service using this image grafana/grafana:10.3.5 (check for newer versions). We told the service it depends on the prometheus service as it's the one to deliver our scraped metrics.
A couple of volumes have been mounted into the service.
- We have a dedicated volume for Grafana data. This is for persisting data inside the Grafana service, in case of server reboots.
- Then we have the provisioning folder, where our
custom.inifile lives and the data sources + dashboards. - Finally, we have a mapping of type
bind. This one is responsible for binding a specific file (in our case, the json dashboard for traefik) into the path we defined in the dashboard definition earlier. Grafana will now see the dashboard file as a file inside the container, as we have mapped it into a special location.
In the environment section we instruct Grafana to install a set of plugins. You can extend this list if you would like to. There are more plugins available at Grafanas website.
In the deployment section, we have the usual Traefik labels. Only change for this compared to cAdvisor and Prometheus, is that I have removed the basic authentication. This makes it possible to share dashboards with the public. We have already added a user in the custom.ini file, so no need to worry abou that.
Deploy The Metrics Stack
Now for the grand finale! The moment you probably have been waiting for in a long time 😅
Navigate to the metrics folder, where you have the docker-compose.yml file and run the following command.
docker stack deploy -c docker-compose.yml metricsThis will probably take a moment, as Docker now has to pull the three images from Docker Hub before it's able to launch them. Go grab a cup of coffee and open your Traefik Dashboard. After a moment, you should be able to see the three new services with their path prefix.
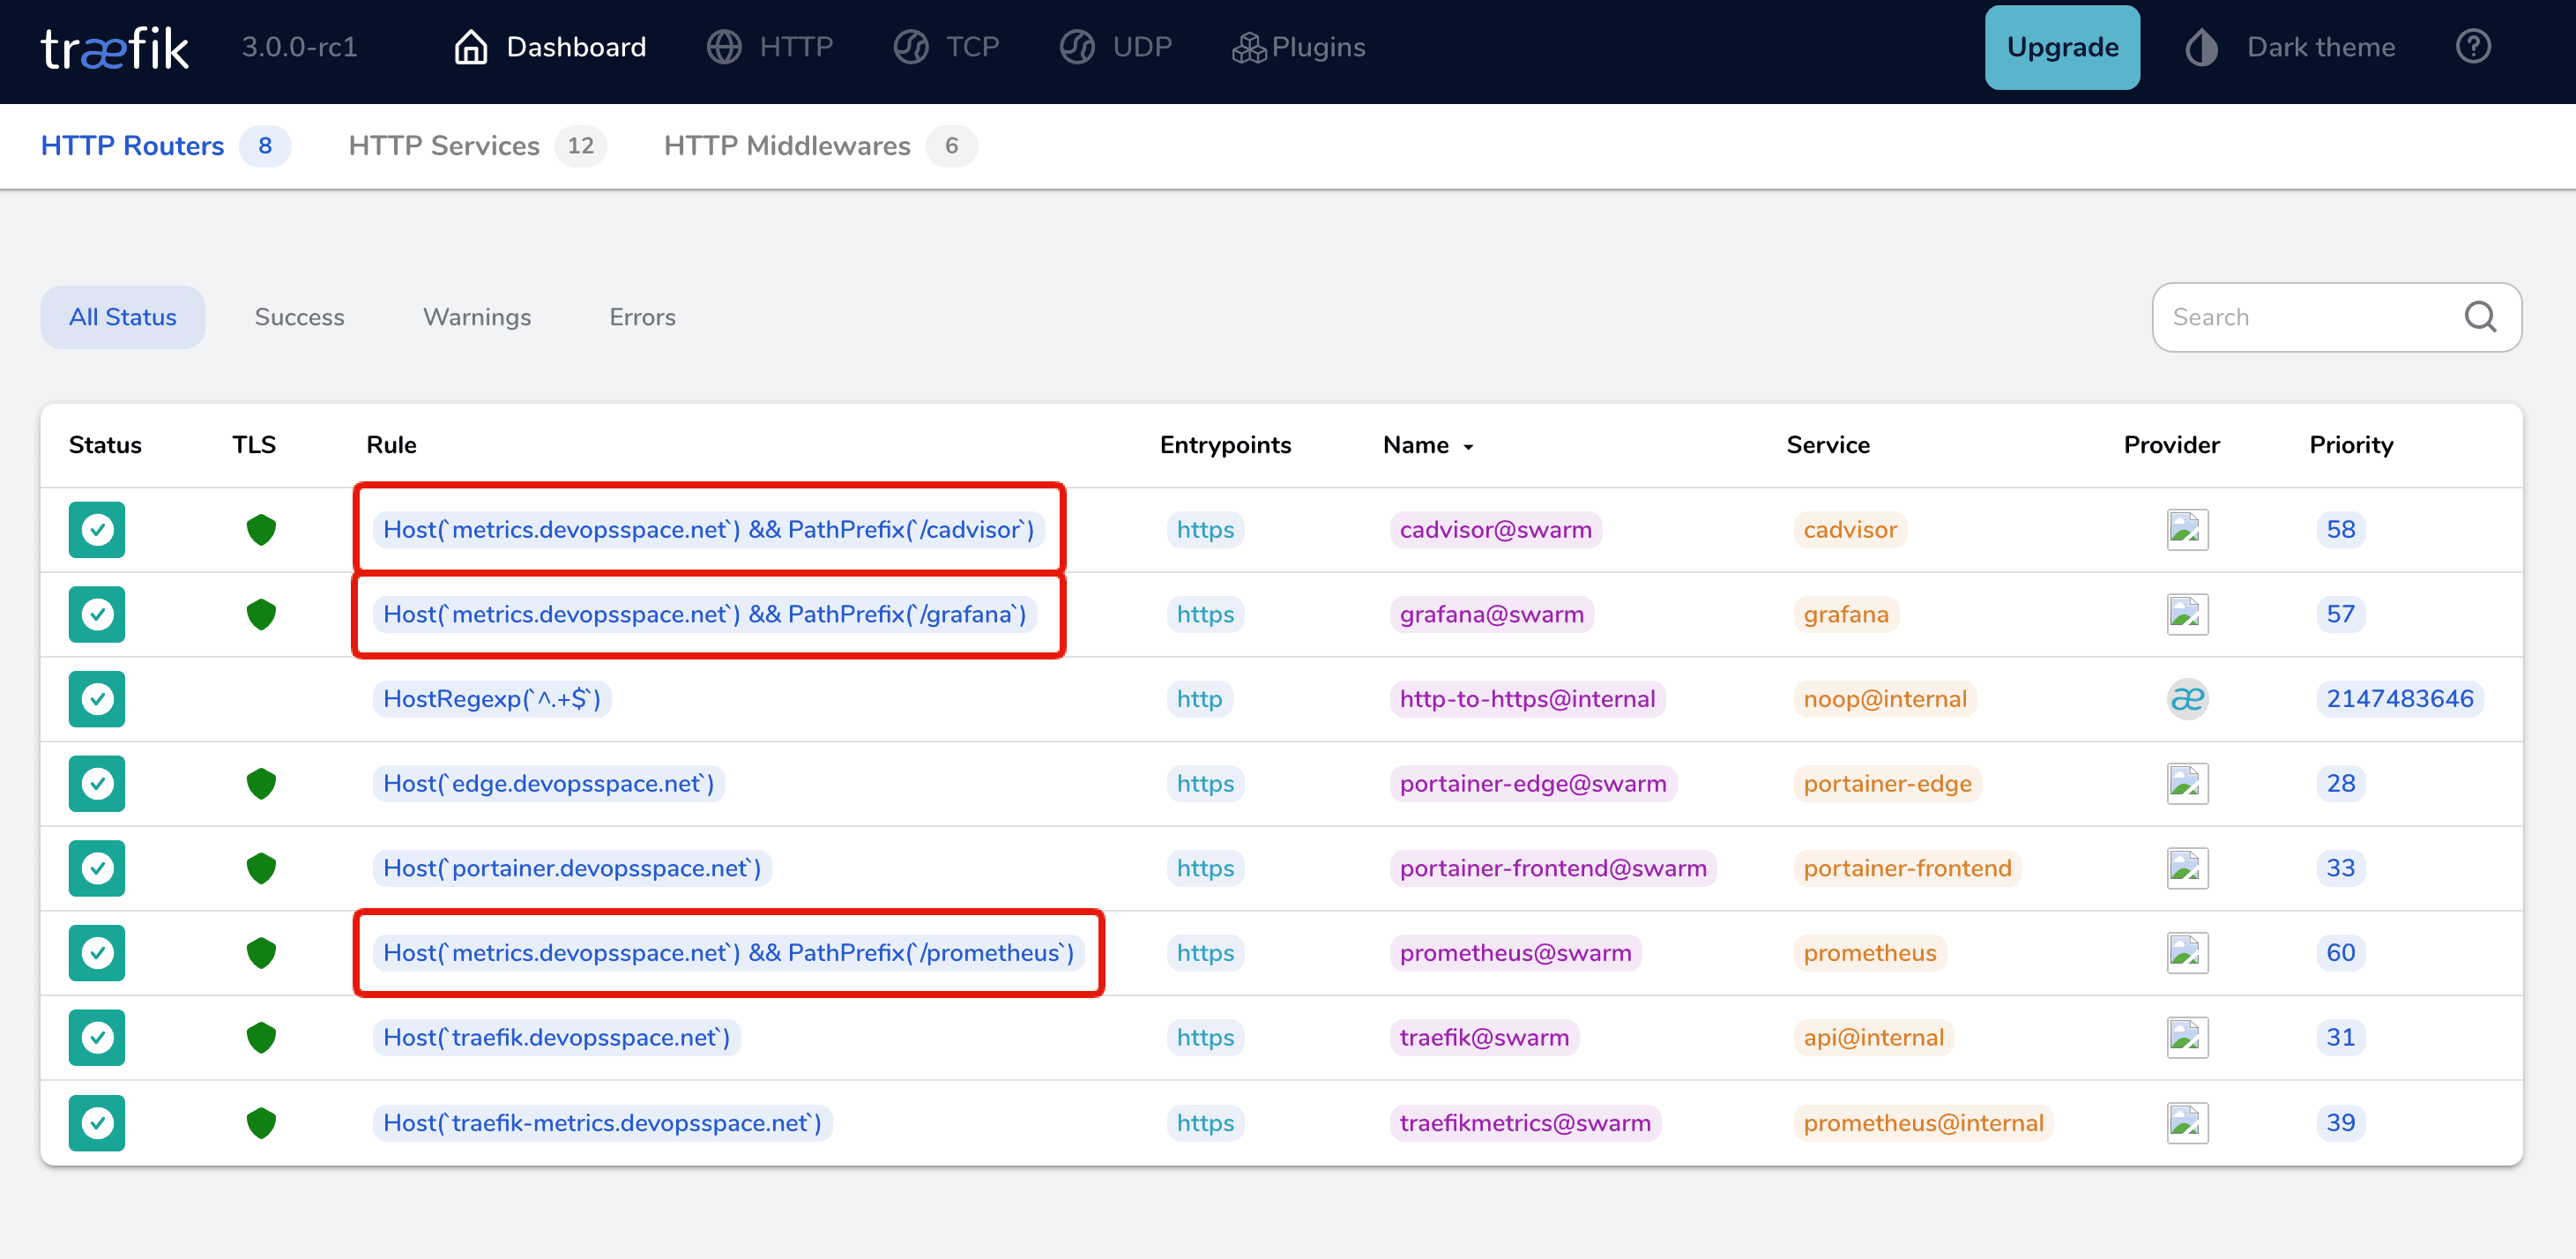
Wohaa! 🎉 🍾
All three of them are there! Now navigate to each of them and check them out. A few URLs I would recommend you to check out are the following:
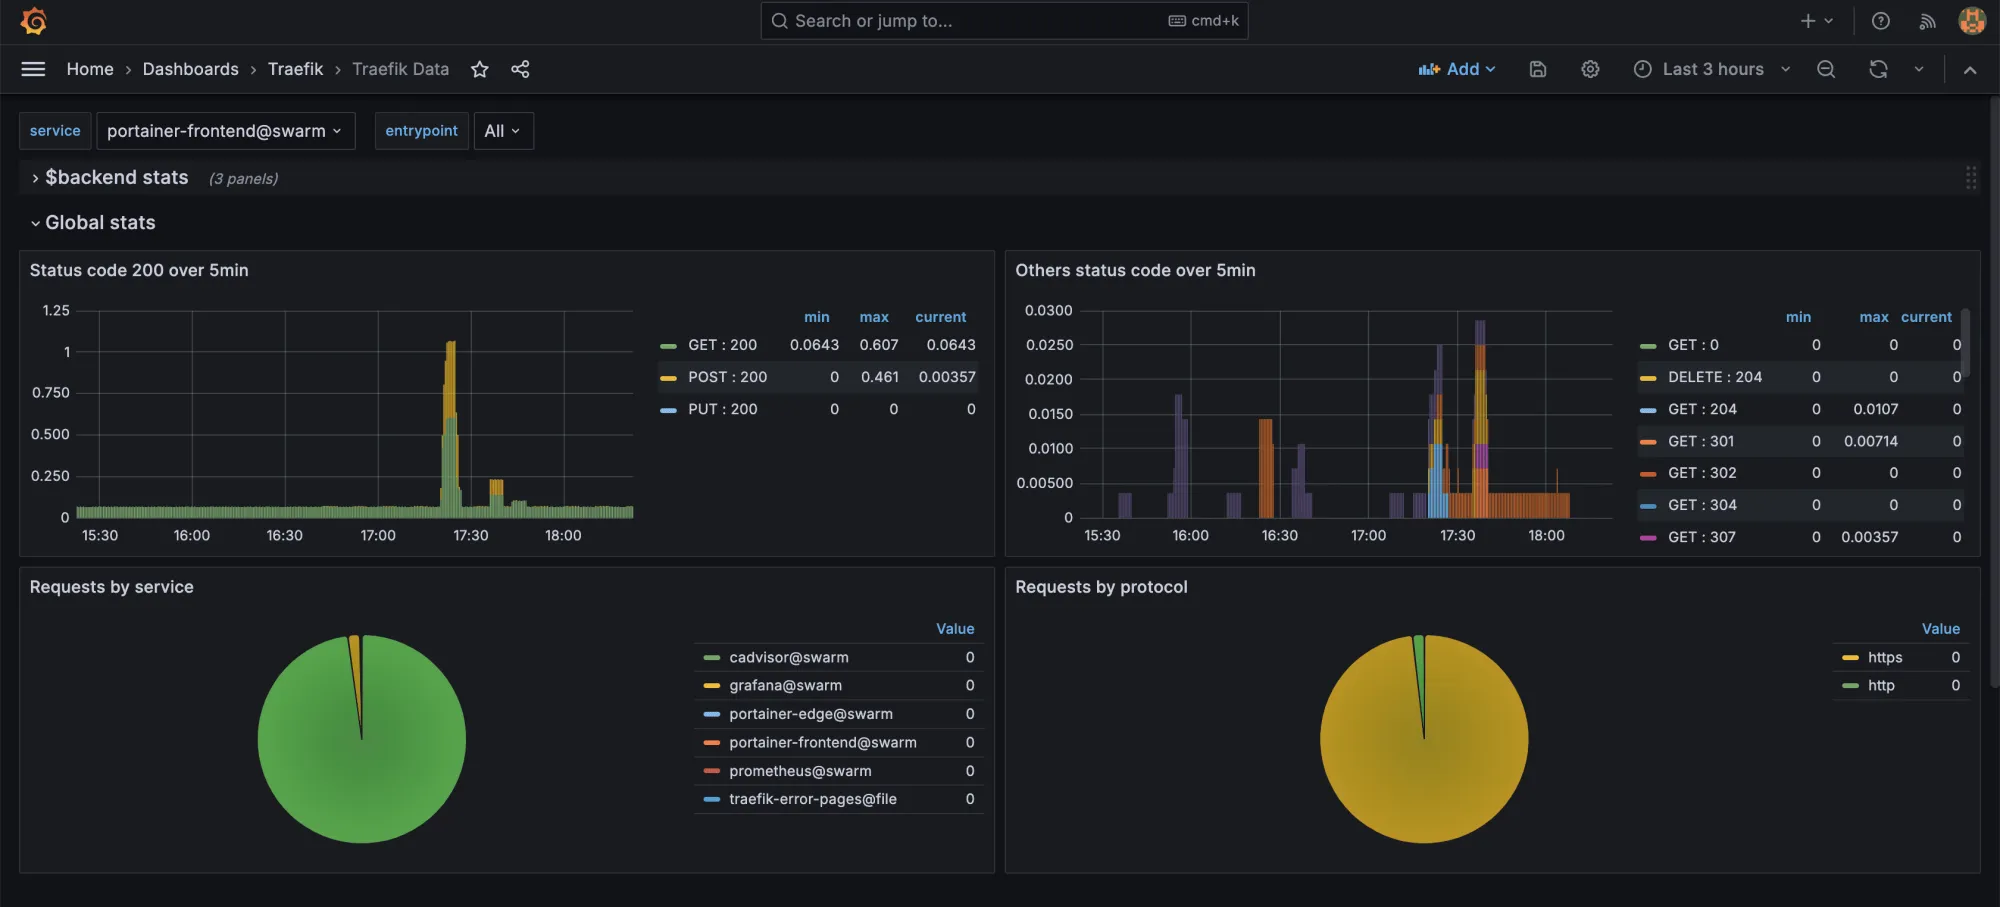
- https://metrics.your-domain.com/grafana/dashboards
- https://metrics.your-domain.com/prometheus/targets
- https://metrics.your-domain.com/cadvisor/containers
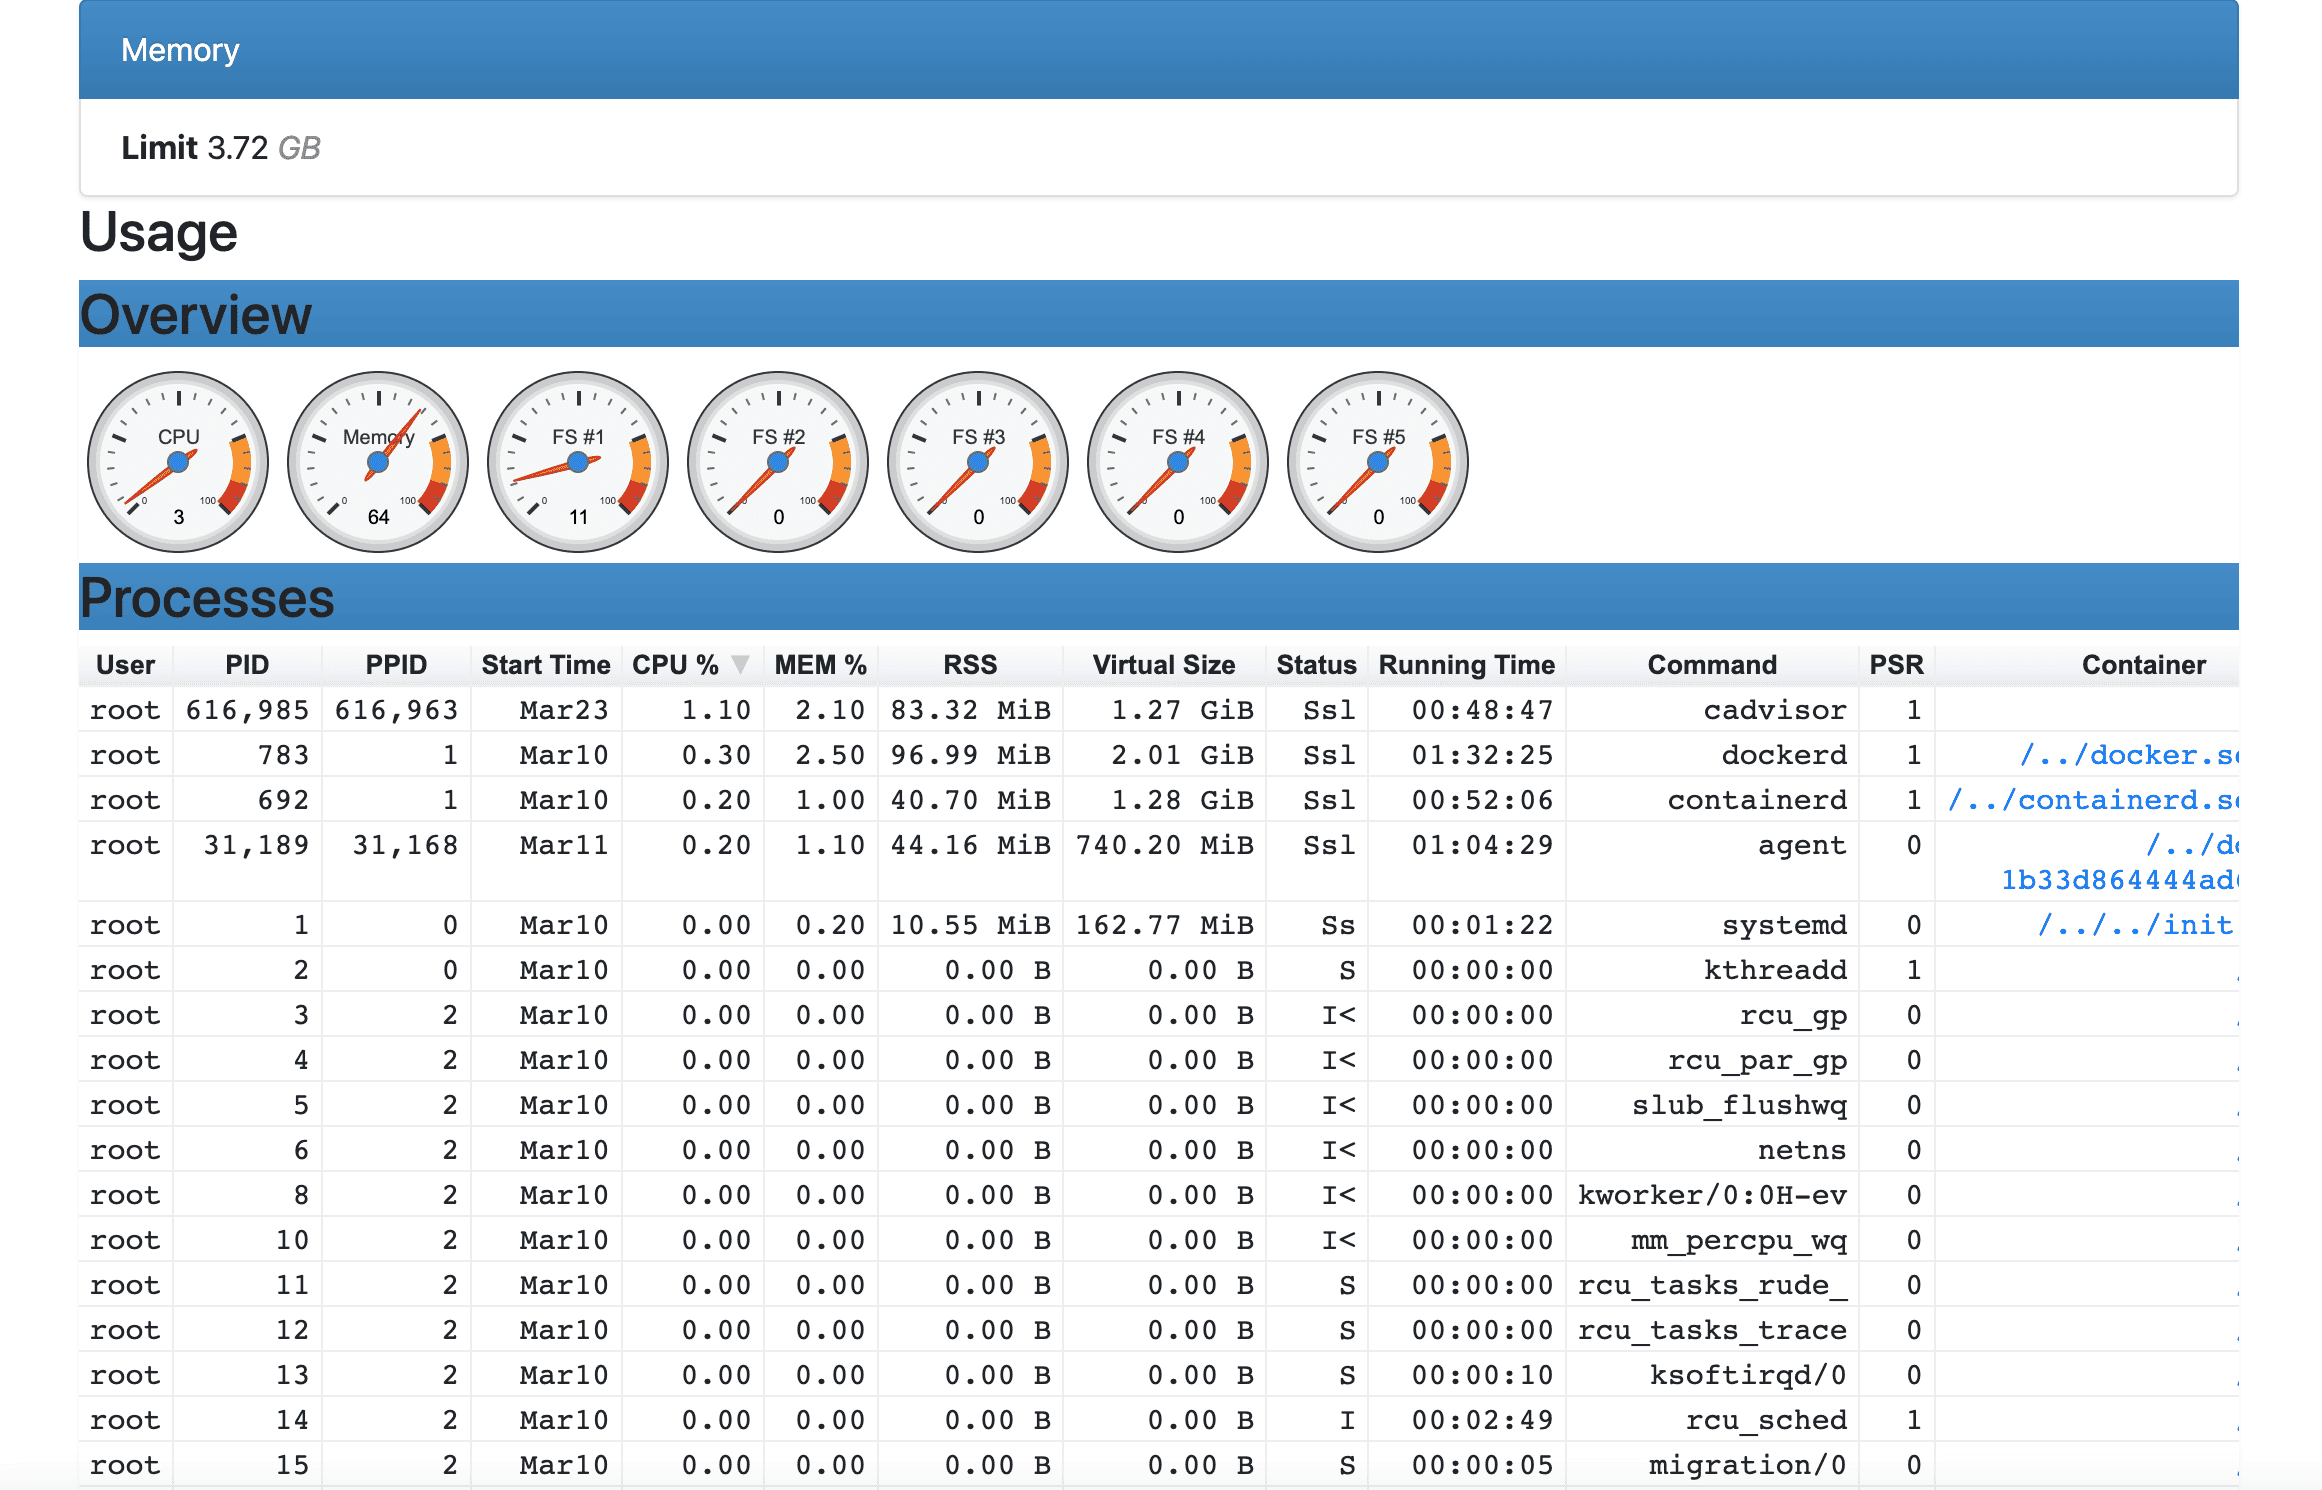
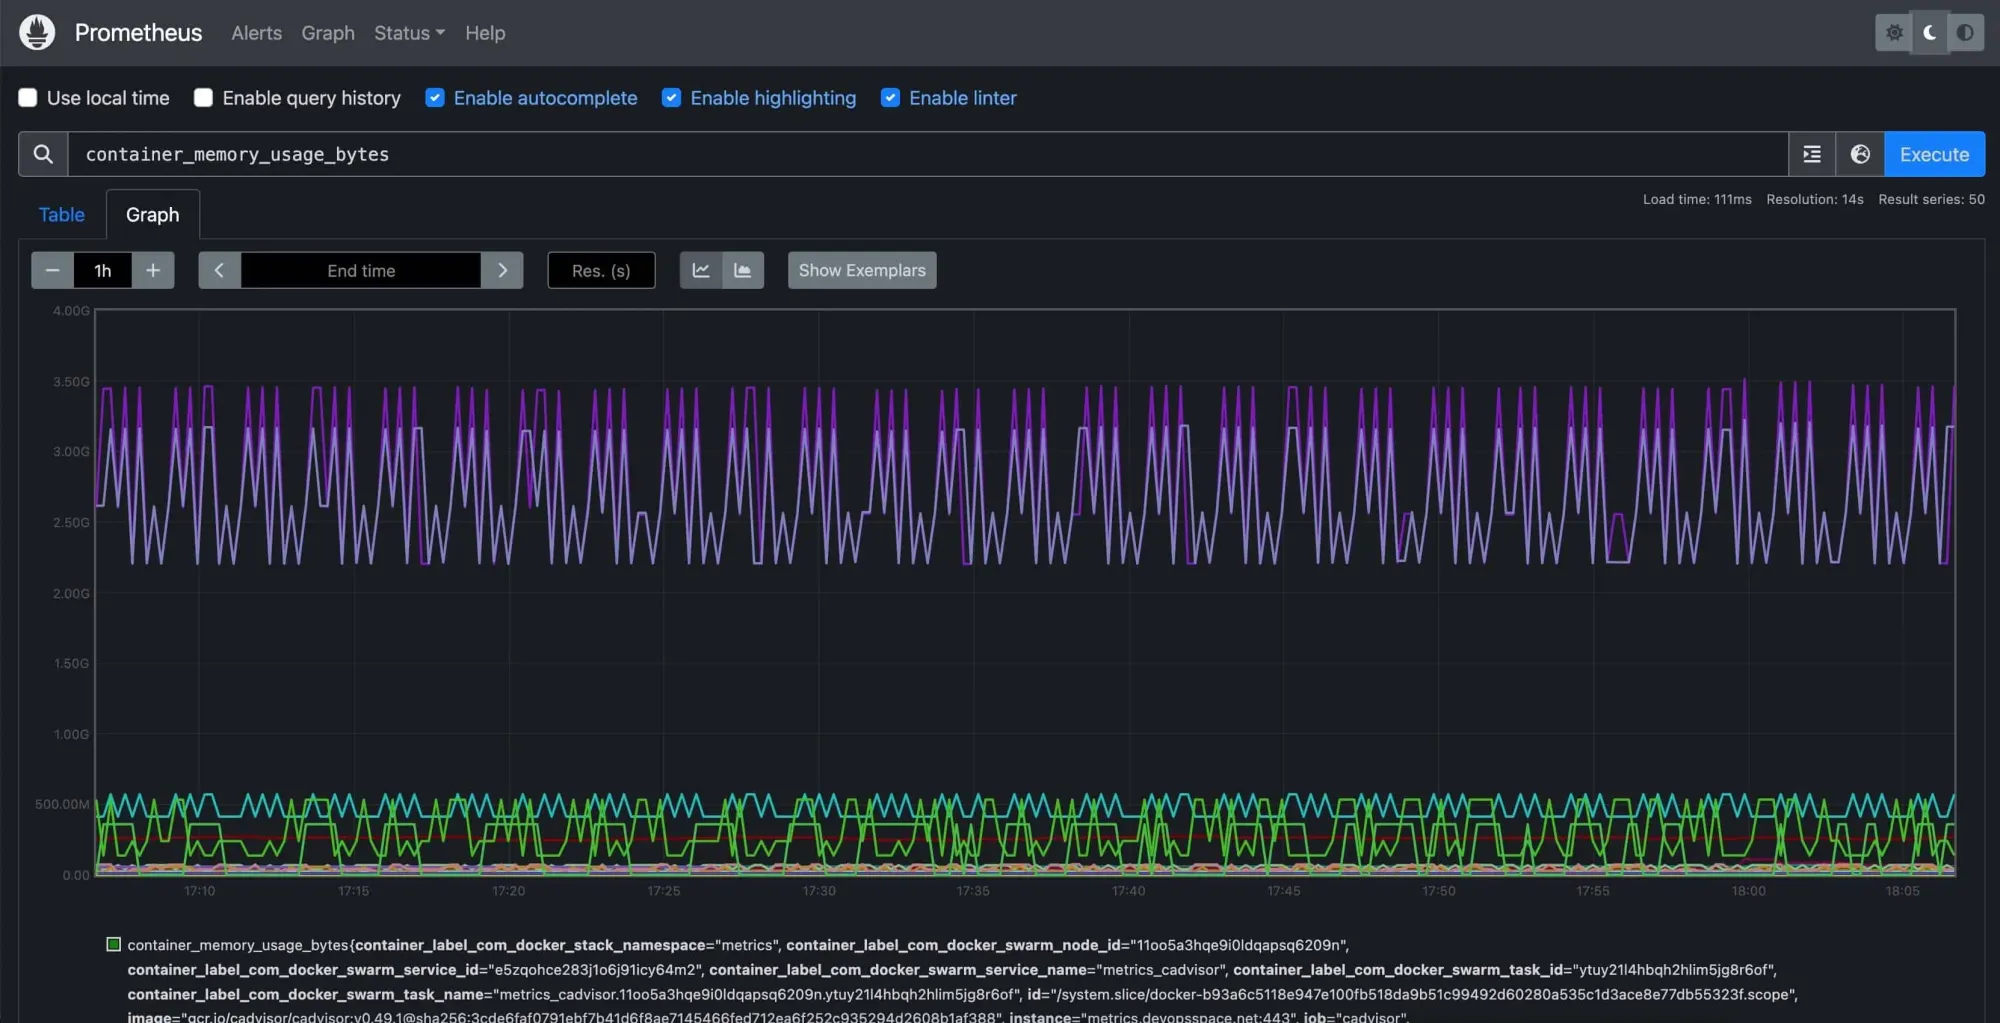
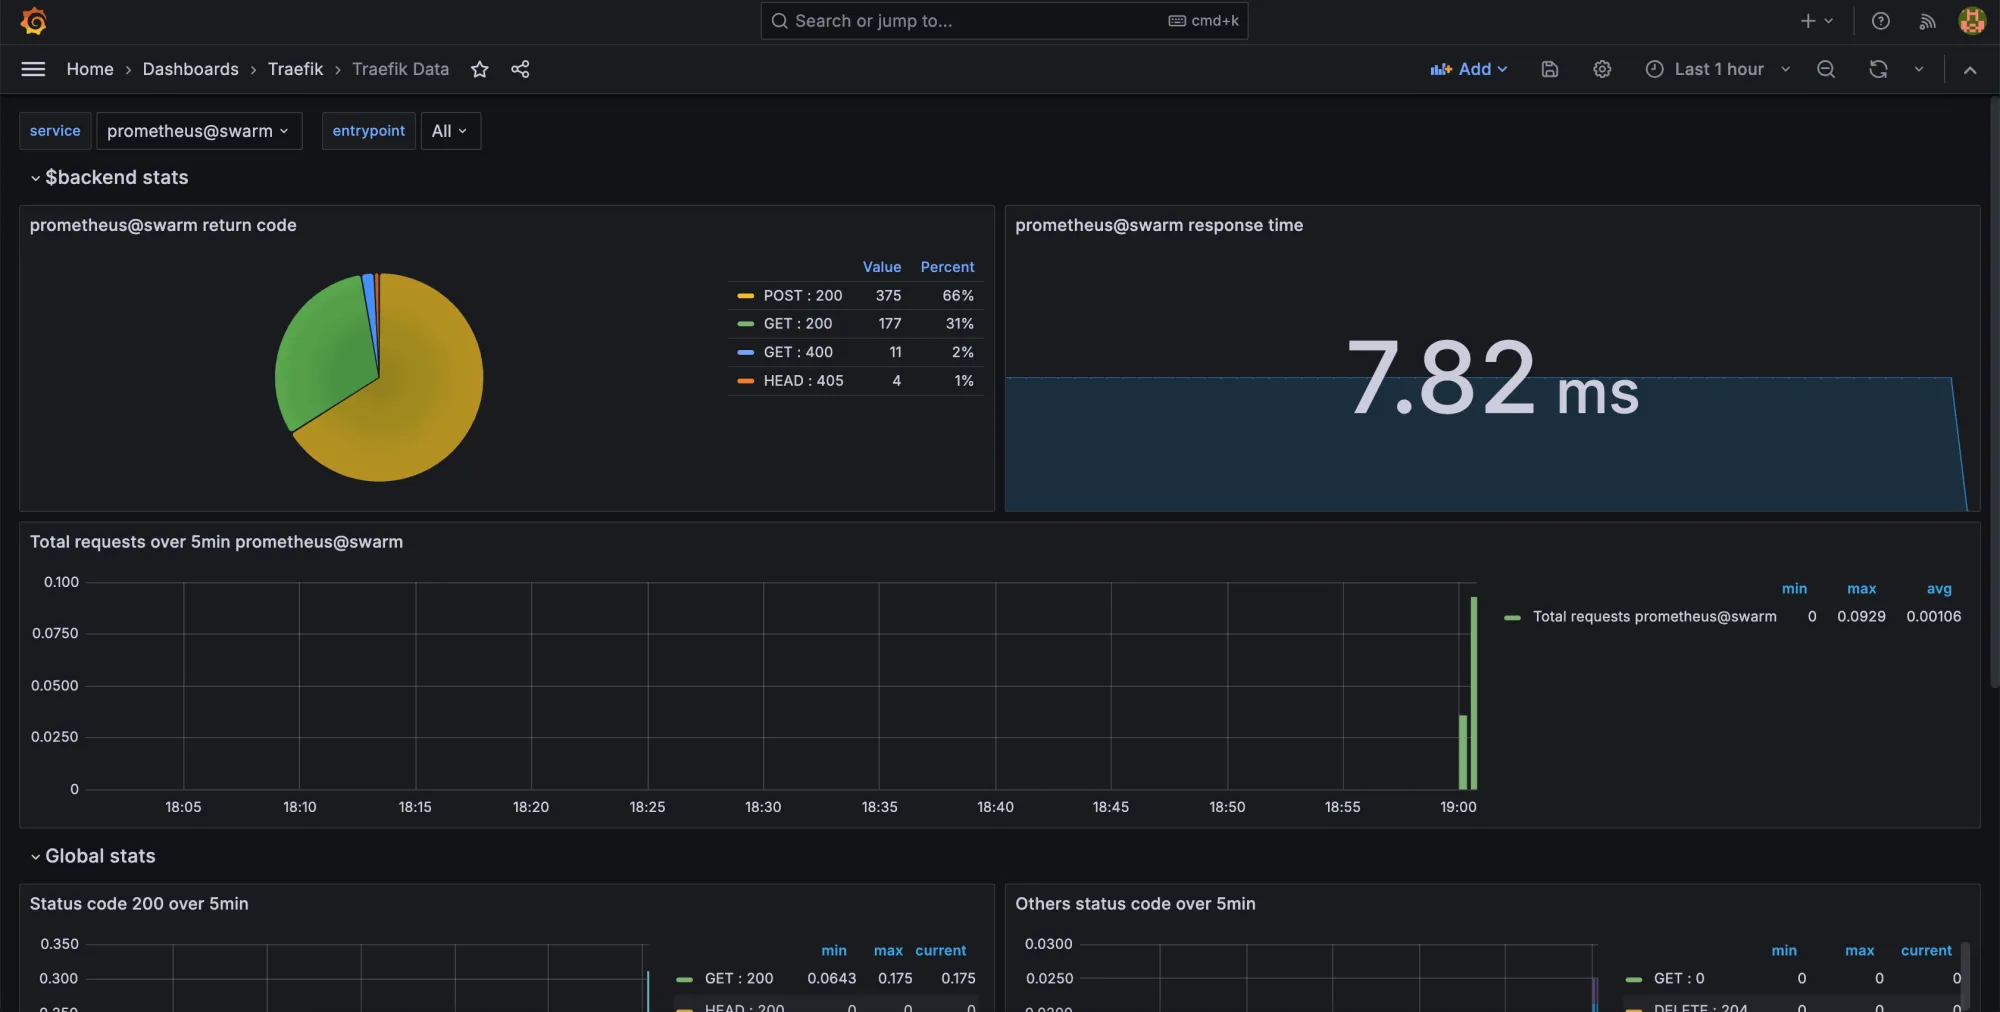
A few images from the running metrics services
Summary
I know this was a long one, but I really wanted to make sure that you got everything explained well and nothing was rushed. 😅
In this section of my Docker Hosting Platform series, you learned how to configure Prometheus and Grafana using code and how to deploy them using Docker Compose. At the same time you learned how to deploy cAdvisor globally in your Docker Swarm cluster.
If you got any questions, please let me know in the comments below. If you enjoyed this section, you are more than welcome to share a word or two also, or by sending me an email.
In the next setion, we are looking at Crowdsec to make our hosting platform more secure. 🔒 🛡️ See you in a moment! ✌️

.png)